Reversal candlestick patterns are widely used in technical analysis to identify possible changes in price direction after an existing trend. These patterns are formed using a security’s open, high, low, and close prices within a specific time period, helping traders visually understand shifts in market sentiment. When a reversal pattern appears after a sustained uptrend or downtrend, it may signal that buying or selling pressure is weakening.
Traders use these patterns to anticipate potential entry or exit points rather than reacting late to price movements. However, reversal candle patterns are most effective when analysed with trend context, volume, and other technical indicators, as they indicate probability, not certainty.
Key Takeaways
- Reversal candlestick patterns signal potential trend changes after a clear uptrend or downtrend.
- These patterns reflect shifts in market sentiment using open, high, low, and close prices.
- Confirmation through volume, support-resistance, and indicators improves reliability.
- They guide trade timing but indicate probability, not guaranteed price movement.
Decoding Reversal Candlestick Patterns
Candlestick patterns are critical technical tools, used widely by traders to identify underlying asset price movement. Candlesticks capture the opening, closing, high and low of an underlying asset in a single bar pattern, which reduces the need to compare multiple trading charts to understand asset price movement.
Apart from this, candlestick charts are also useful in predicting possible trend reversals in the trendline. There are several trend reversal candlestick formations, each with different degrees of merit. In this article, we will talk about the most powerful and common ones and how to interpret them when you are trading.
Also Read: What is Candlestick Chart Patterns
Reversal candlestick patterns
What Are Reversal Patterns?
Reversal patterns mean the formation of candlesticks, which indicate the end of the existing trend (uptrend or downtrend). When such a pattern appears in a downtrend, it indicates a bullish reversal or the end of a selling spree and the onset of a buying spell. Conversely, when a trend reversal pattern forms in an uptrend, it warns traders of a possible end to the bullish run and a decline in momentum.
Candlestick patterns are visual patterns, helping traders to visualise when market sentiment is shifting, which is why many traders prefer candlestick charts over other trading tools. However, any trend reversal indication must conform to other popular technical trading tools.
How To Identify the Reversal Candlestick Pattern?
Identifying reversal candlestick patterns requires a mix of technical understanding and market context. These patterns are meaningful only when they appear after a clearly established uptrend or downtrend, as a reversal can occur only if a trend already exists. The first step is to assess the current market direction and locate key support or resistance levels where price reactions are more likely.
Strong reversal signals often show signs of exhaustion in the existing trend, such as long shadows against the trend, gaps between candles, or sudden changes in candle size compared to recent price action. A visible shift in momentum is important, usually reflected through larger bodies forming in the opposite direction of the prevailing trend.
Volume plays a critical confirmation role. Genuine reversals are often supported by increased trading activity, indicating broader market participation. Traders should also study candle structure closely, including the relationship between open and close prices, shadow length, and how new candles interact with previous ones. Context and confirmation remain essential.
Top Seven Reversal Candlestick Patterns
Steve Nison, who introduced candlestick patterns to Western technical analysis, mentioned seven reversal patterns that are more influential than others. In his book Japanese Candlestick Charting Techniques, he mentioned a few distinct reversal patterns.
Engulfing Patterns
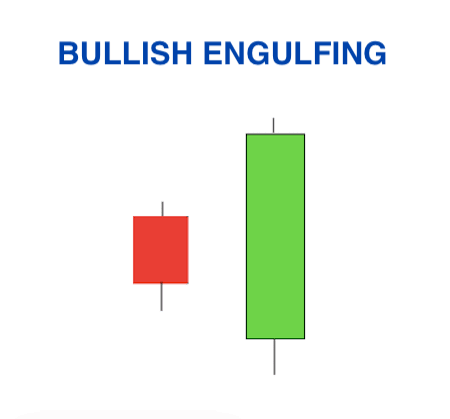
An engulfing pattern is a two-candle formation that signals trend reversal, and hence, there are bullish engulfing andbearish engulfing patterns.
The bearish engulfing happens in the uptrend. The first candle is a white/green candle that forms in the uptrend. The second candle opens higher than the previous session and then closes below the previous. It indicates a final bullish attempt before sellers regained control.
The opposite of bearish engulfing is bullish engulfing, and it appears at the bottom of a downtrend.
Doji
Doji is a unique formation – a candle with no real-body but with shadows. Doji can take many forms like Doji Star, Dragonfly Doji, Gravestone Doji, Long-legged Doji, and more.
It is often associated with market indecision before a trend reversal. Apart from Doji star, Dragonfly Doji and Gravestone Doji also indicate a trend reversal; but to base your trading decisions on them, those must concur with other popular trading tools like moving average, RSI, or moving oscillator.
Doji formations often have no real body, meaning that the opening and closing prices are almost the same, or the market has reached an equilibrium where neither the buying nor the selling strengths are strong enough to give it a direction.
Abandoned Baby
Apparently, an abandoned baby is a more decisive trend reversal pattern than a Doji. It is a rare formation, but when it appears, it is a strong enough indication for traders to alter their position accordingly.
Since it is a trend reversal pattern, an abandoned baby can appear in both an uptrend and a downtrend. An abandoned baby is a Doji star that appears between two candles – the first one appearing in the direction of the trend and the second confirmation candle appearing in the reversed trend, either bullish or bearish. The shadow of the first candle mustn’t overlap the second candle. The star appears above or below the trend, appearing isolated due to a gap on both sides.
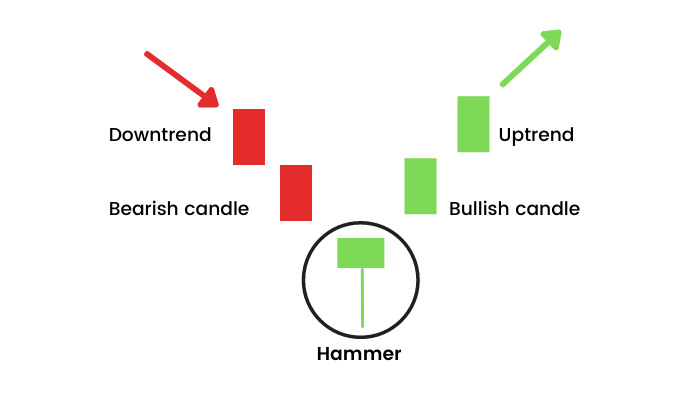
Hammer Pattern
Hammer is a single candle pattern that appears in a downtrend, implying a trend reversal to bullish. It usually has a small real body and a long downward shadow. It indicates price rejection, but eventually, buying forces were strong enough to push the market up. The result is a bullish or green candle comprising a short real-body. The candle appearing next to the hammer must confirm the trend reversal to form a trading strategy. It must close above the last candle formed before the hammer.
The opposite pattern of a hammer, an inverted hammer which appears in an uptrend, is also a trend reversal pattern. In this case, the colour of the hammer doesn’t matter, but the upper shadow is twice the size of its real body. An inverted hammer requires stronger confirmation candles to ascertain trend reversal.
Another similar pattern that appears in the candlestick chart is called a hanging man. It is a hammer that appears in an uptrend. When the hanging man appears after a rally, it indicates a trend reversal. It needs further confirmation from the following candles appearing in the trendline. If those appear in a downtrend, the hanging man confirms a downward trend reversal.
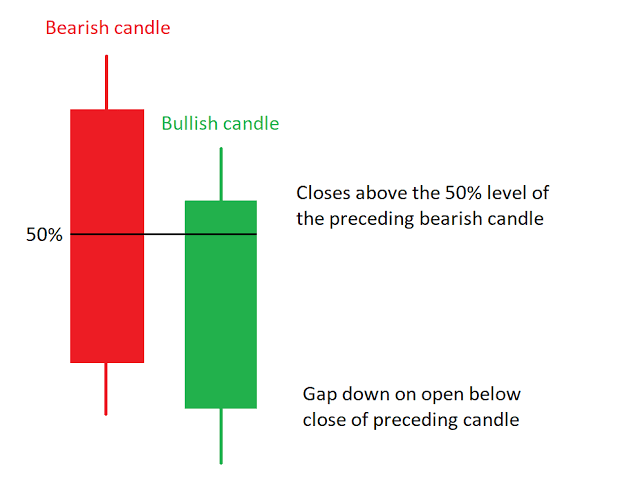
Piercing line
A piercing line is a two-candle formation – a bearish long-bodied candle and another bullish candle which opens at a gap and closes at the midway of the bearish candle. Both candles have robust long bodies. It shows that the market started in bearish impulse, but eventually, buyers gained momentum to pull the market up and reserve their position.
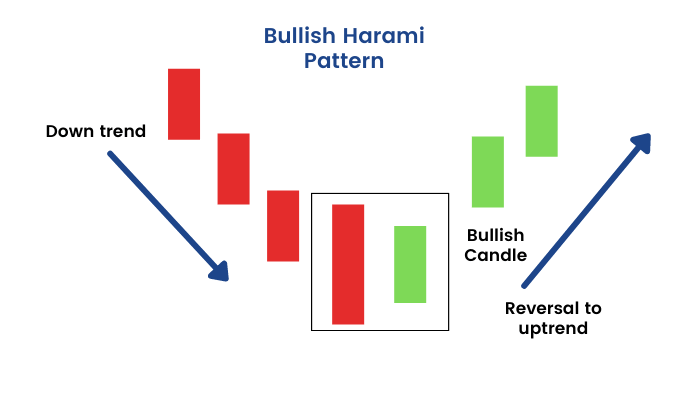
Harami Patterns
Harami patterns are common and can be both bullish harami and bearish harami. In Japanese, the word translates to pregnant. It is a two-candle formation where the second candle is a small-bodied candle that opens and closes within the body of the first candle, representing a pregnant form. In the case of Harami Cross, the second candle is a Doji star. A Harami is a reversal pattern, but it isn’t as strong as the hammer and needs confirmation from other technical trading tools like RSI, MACD, and the like.
Morning and Evening Stars
The star formation is a three-candles formation that appears in both up and downtrend. The bearish star is called evening star, and the bullish star called the morning star.
The first candle appears in the trend, either bearish or bullish. The second is a small-bodied candle opening and closing above or below the first candle in the trend, indicating indecision. The third candle is a confirmation candle that confirms the trend reversal. Like other candlestick trend reversal formations, stars confirm a reversal when combined with other technical tools.

How to Use Reversal Candlestick Patterns in Trading?
Reversal candlestick patterns are most effective when used with proper context and confirmation. The first step is to identify an existing trend, as reversal patterns only have meaning after a clear uptrend or downtrend. A bullish reversal carries more value near strong support levels, while a bearish reversal is more reliable near resistance zones. Traders should wait for the complete formation of the pattern instead of acting on partial candles, as early entries often increase risk.
Reversal patterns should not be used in isolation. Combining them with support and resistance levels, trend lines, moving averages, or momentum indicators helps improve accuracy. Volume is another key factor, as genuine reversals are often supported by higher trading activity, showing stronger participation.
Risk management is essential. Traders should define stop-loss levels around key support or resistance points and avoid overcommitting capital. Aligning signals across multiple timeframes further improves decision-making and trade quality.
Conclusion
Candlestick patterns are useful for traders to visualise when the market is changing. They help them understand opening, closing, high, and low from a single candle and eliminate the need to compare several charts to confirm trading.
Reversal patterns warn traders of possible change so that they can enter long or safeguard against any drawdown when the trend changes to bearish. Traders use candlestick charts along with other technical tools for a better trading strategy.
