
Backtest trading strategies using historical data
Connect your Angel One account to TradingView and trade seamlessly on the industry-leading charting and trading platform

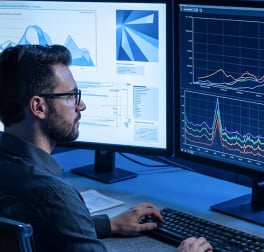
Everything you need for advanced technical analysis is in one place
Analyse multiple charts together

Analyse charts using RSI, MACD and other indicators

Draw trendlines, Fibonacci levels, and channels

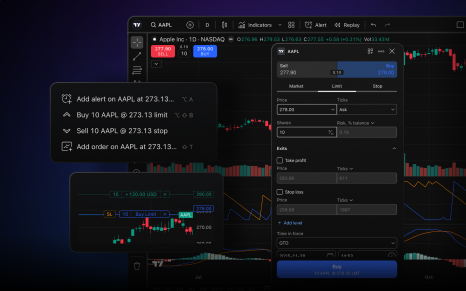
Place buy and sell orders from charts

Set alerts based on price or indicators

Track open orders directly on charts

Use charts across multiple screens

Track price movement across charts

20+ interactive and responsive chart types with 110+ drawing tools and extensive customization options.
400+ built-in indicators for popular strategies, plus thousands of custom indicators created by the community
Stay on top of market moves with 13 alert conditions on price, indicators, and strategies.
Asset screeners with 100+ technical and descriptive criteria, along
Join a community of over 100 million traders where you can learn from your peers, share knowledge and follow top traders criteria, along

Professional-grade tools designed for faster execution and deeper analysis

Analyse options data across strikes and expiries

Place multiple orders in a single transaction

Analyse market depth and order flow

Adjust orders by dragging on charts

Track P&L as prices change

Track price trends using anchored VWAP
Professional-grade tools designed for faster execution and deeper analysis
Compare stocks, indices, and sectors across timeframes to identify trends faster
View multiple charts on one screen
Available only when accessing the full charting/dashboard after login.
Compare multiple assets on one screen
Create, backtest, and refine strategies using a range of analytical tools
Backtest trading strategies using historical data
Build custom indicators and automated strategies
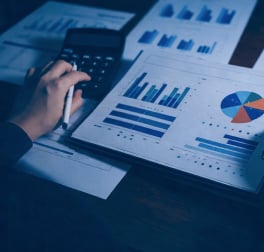
Test investment strategies without using real money
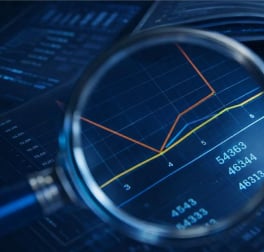
Analyse past market data to identify patterns
Everything you need to analyse, trade, and grow, without limitations
Seamless TradingView integration
Real-time market data with zero lag
Direct chart trading — no screen switching
Large and active investor community
Advanced analysis tools for every strategy
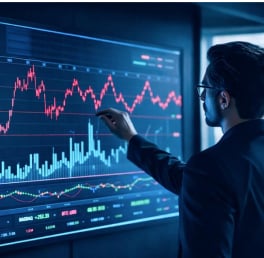
TradingView charts are advanced tools used to analyse price movements and identify trading opportunities
Learn to read candlestick, line, and bar charts to understand price movements
Use indicators like RSI, MACD, VWAP, and moving averages to support decisions
Identify bullish and bearish trends across different timeframes
Known for its accuracy, powerful tools, and active trading community
Empowering millions of Indians to trade and invest with confidence


