Intraday candlestick chart patterns are visual representations of price movements within a single trading session. They display the open, high, low, and close prices for certain time periods and aid the identification of trend continuation, reversals, and changes in market sentiment. These patterns originated in Japan and are now extensively used across global financial markets such as stocks, currency, and derivatives. While traders' views may differ, candlestick charts give organised price data, allowing for systematic intraday market research.
Key Takeaways
-
Intraday candlestick patterns display open, high, low, and close values across short time periods.
-
They assist in interpreting market emotion, trend strength, and momentum during the trading day.
-
Common patterns include doji, hammer, shooting star, engulfing, and consolidation shapes.
-
Candlestick patterns aid technical analysis, but they do not predict future market results.
How to Understand Intraday Candlestick Patterns?
Understanding candlestick patterns for intraday trading entails studying how each candle indicates price movement over a certain time frame and how multiple candles combine to form recognisable structures. Each candlestick represents four data points: open, high, low, and close. The candle body indicates whether the price increased or decreased during that time period, while the wicks represent the highest and lowest traded prices.
Key components of a candlestick:
-
Open: Price at the beginning of the interval.
-
Close: Price at the close of the interval.
-
High: Peak price during the interval.
-
Low: The lowest traded price within the interval.
-
Body: The difference between open and close indicates bullish or bearish control.
-
Wicks: They indicate price rejection or volatility outside the body.
Common interpretive factors include:
-
Trend context: Patterns have various meanings in uptrends and downtrends.
-
Volume confirmation: Higher volumes can enhance the credibility of signals.
-
Support and resistance: Reversal patterns frequently occur at key price points.
-
Pattern structure: Single candles (e.g., doji), double candles (e.g., engulfing), or multi-candle formations.
Below is a simplified reference for candle body interpretation:
|
Candle Type |
Close vs Open |
Typical Interpretation |
|
Bullish |
Close > Open |
Buying strength |
|
Bearish |
Close < Open |
Selling strength |
|
Neutral (Doji) |
Close ≈ Open |
Indecision or balance |
Overall, intraday candlestick patterns are best understood when analysed in context and not in isolation.
Breakouts and Reversals
Before we look at some of the most common intraday chart patterns, here are two recurring themes visible on all trading charts. Irrespective of the different types of intraday patterns and charts you use to base your trades on, you will notice two recurring themes when you trade. These themes are breakouts and reversals. Let’s understand these briefly.
Breakouts
A breakout occurs when the price of a stock clears a particular, critical level, such as a support level, a resistance level, a trend line, or a Fibonacci level, on your trading chart.
Reversal
A reversal is essentially a change in the direction of a given price trend. This change could be a positive or a negative change against a prevailing trend.
A Look at the Different Types of Intraday Chart Patterns
When it comes to intra-day trading, there are several types of candlestick charts that we traders rely on to base our trades. Let’s understand what candlestick charts are, along with some of the best candlestick patterns for intraday trading.
Candlestick Charts
The most common types of technical tools used by intraday traders are intraday candlestick patterns, which first originated in 18th-century Japan. Japanese rice traders were the first people to use these charts, and they were introduced in the Western world as late as 1991 by Steve Nison.
A candlestick chart essentially consolidates data within specific time frames, ideally into single bars. Intraday candlestick patterns are straightforward and relatively easy to interpret. Leveraging these charts while trading can give you a competitive edge over traders and the rest of the market participants.
Candlestick patterns are further categorised into several types, with the following five being the most widely used patterns by traders across the globe:
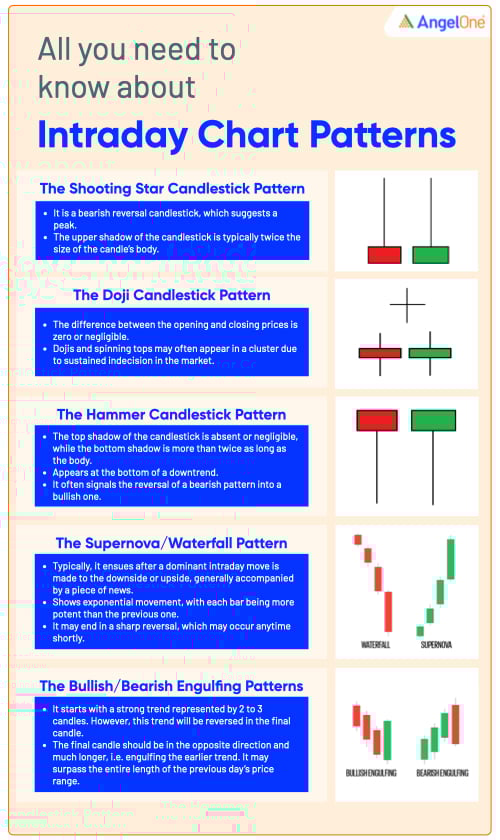
The Shooting Star Candlestick Pattern
The shooting star candlestick is primarily regarded as one of the most reliable and one of the best candlestick patterns for intraday trading. In this type of intra-day chart, you will typically see a bearish reversal candlestick, which suggests a peak, as opposed to a hammer candle, which suggests a bottom trend.
The shooting star candlestick typically will not form unless a minimum of three consecutive green candles materialise. Once the pattern forms, it indicates an increase in the demand and price of the stock.
Note that this type of intraday chart pattern is that the upper shadow of the candlestick is typical twice the size of the candle’s body. This, in turn, indicates that the last of frantic buyers have entered the trade, precisely at the time when traders who have booked profits have offloaded and closed their positions. The price is then forced down by short-sellers to close the candle (either close to or below the open), which traps late arrival traders who had pushed high, the price high. At this point, traders begin to panic as the late arrivals begin exiting their positions swiftly.
The Doji Candlestick Pattern
The Doji pattern is a popular candlestick pattern for intraday trading that is predominantly used by forex and stock traders. The term “Doji” implies indecision among traders. The reversal pattern of this candlestick may be bullish or bearish, based on the previous candles. The pattern essentially has the same open and closing prices and is recognised by its long shadows.
Moreover, while the pattern appears close, it may have a relatively small body. As a trader, you will get an indicator which suggests how the reversal is heading, from the previous candles. In case of bullish candles, a short/sell signal will be triggered when a Doji low breaks, whereas a trail will stop above a Doji high. As a trader who wants to use the Doji candlestick pattern for intraday trading, you will need lots of experience, so it is recommended that you practice reading it on trading simulators before you start active trading.
The Hammer Candlestick Pattern
The hammer candlestick pattern is a bullish reversal candlestick pattern for intraday trading. Traders routinely use this candlestick to establish capitulation (surrender) bottoms. The hammer candlestick is generally followed by a price bump, which enables traders to enter a long position. It is easy to recognise this candlestick, which forms when a downtrend ends, suggesting a near-term bottom of the stock’s price.
The lower shadow is formed by a new low, while in a downtrend, which closes near the open. The lower shadow, also referred to as the tail of this candlestick, should be a minimum of twice the size of the candle’s actual body. As a trader, you can ascertain a hammer candle by checking the closing of the next candle, which should be above the low of the hammer candle.
The Supernova/Waterfall Pattern
The supernova intraday trading candlestick pattern, sometimes known as the waterfall pattern, is one that typically ensues after a dominant intraday move is made to the downside or upside. This pattern is generally accompanied by a piece of news released by a company or the announcement of an event.
Recognising this chart pattern is easy, as it includes a typical exponential move with each bar being more potent than the previous one. On the price chart, the supernova pattern appears as if the market can’t go any lower or higher.
While it may be slightly tricky to trade with these moves, it is essential to remember that the market cannot forever go up. As such, when the supernova pattern emerges, you should brace yourself for a sharp reversal, which may occur at any time shortly. The reversal may typically be caused by traders booking their profits.
The Bullish/Bearish Engulfing Patterns
The Bullish/Bearish Engulfing Patterns are yet another type of Japanese candlestick pattern for intraday trading, which are considered powerful market indicators, especially in the context of short-term trading. The bullish engulfing pattern typically emerges when a red down candle, characterised by a short wick, is closely followed by a significantly larger green candle, which also has a short wick.
The green candle completely engulfs the preceding red candle. Conversely, the bearish engulfing pattern is in complete contrast to the bullish engulfing pattern, in that the relatively smaller green candle gets engulfed by a significantly larger red candle. The bullish and bearish engulfing patterns essentially suggest the beginning or continuation of a new trend emerging in the direction of an engulfing candle.
The two candles indicate that one side of the market has been overpowering the other. It should be noted that the bullish and bearish engulfing patterns are at their most potent when they are combined with massive volumes or when the company releases information or news, which is consistent with the direction in which the trend is moving.
Other common intraday chart patterns
Apart from the intraday trading candlestick patterns mentioned above, there are several other intraday chart patterns used by day traders. They are as under:
The Morning Consolidation Pattern
The morning consolidation pattern is a type of intraday chart pattern that is relatively easy to recognise. It comprises a minimum of four bars which move in one clear direction. Once a high or a low is reached from the first bar, the security being traded will start consolidating from one bar to four bars, with the high or low being exceeded in the early trading hours, say by 10:10 a.m.
The morning consolidation pattern is indeed one of the most popular ones used by active day traders, mainly because it is easily identifiable on trading charts. This pattern also comes to life almost instantly, enabling traders to size their trades up.
Note that the morning candlestick pattern typically follows a small gap and is recognised by several bars moving in one specific direction. This design indicates that a stock is certainly volatile, which is one of the crucial indicators of a profitable intraday trading stock.
The Late Consolidation Pattern
In intraday trading, turning a profit becomes a huge challenge as the day progresses. As such, it takes a lot of effort to perfect trading patterns, and the late consolidation pattern is one of the most challenging ones to master.
In this intraday pattern, you will notice that the stock will carry on rising in the breakout direction, right into the market close. As a trader leveraging this intraday chart pattern, you should look out for other traders who enter a position after 1:00 p.m.; typically, after a significant break in a trend line, which is already lengthy.
You should also check when the trend line started, either on the previous day or the same day, but in the early trading hours. You should again watch out for at least four consolidation bars that precede the breakout.
An obvious advantage of using this trading pattern is that the stock in question has the whole afternoon to run, which gives you the time to step back and watch as the play evolves. Moreover, you will notice better technical working since the morning move catalysts are subdued in the late consolidation pattern.
Trend Lines and Triangle Patterns
As a day trader, you need to draw trend lines to connect two lower highs or even two higher lows to signal a downtrend or an uptrend, respectively. The ideal way in which you should use a trend line is in the context of a longer-term trend. This means that if you have drawn a significant trend line on your daily chart and if the market touches that specific trend line on your 15-minute chart, you will have an excellent opportunity to take your trade in your preferred trend’s direction.
Similar to trend lines, you can also draw triangle patterns on your daily chart. If you draw the triangle pattern and if the market breaks through within a short-term time frame (similar to the 15-minute chart), then you can potentially be among the first traders to benefit from the longer-term breakout, especially if you take a short-term trade.
Conclusion
Intraday candlestick patterns present organised pricing data that may be used to evaluate how markets behave within a trading session. These patterns visually indicate changes in sentiment, trend strength, and volatility by analysing the relationship between open, high, low, and closing prices.
While individual candles offer key data points, wider interpretations are often based on trend context, trade volumes, and supporting technical indicators. Overall, intraday candlestick patterns are an essential part of technical analysis and are commonly utilised in intraday markets for systematic price monitoring and evaluation.
