Stock market is all about prices and timing. Buying and selling securities at the right time when prices are in your favor is all you have to do to make good returns. But it’s not as simple as said. You need to keep track of the movements of the stocks. But how do you do it? The visualization of the movement of stocks can help you analyze the stocks easily and quickly. But how, where, and when can one visualize the data of stock movements?
Charts do the work and present you with the graphical representation of market movements for stocks. All you have to do is learn how to read those charts to analyze the stock movements.
What is a stock chart?
A stock chart is a price chart of particular security of a company or an index, plotted across time. On the X-axis is the time frame (intra-day, daily, weekly, monthly, or other ranges) and on the Y-axis is the price of the stock. It also represents other pieces of information that you will need to get the full picture of how a particular stock is doing in the market.
In this article, we will introduce you to the basic reading of a chart and also give you a glimpse of the charts available on Angel One.
For any stock in a typical chart, the following data representations w.r.t the stock can be seen:
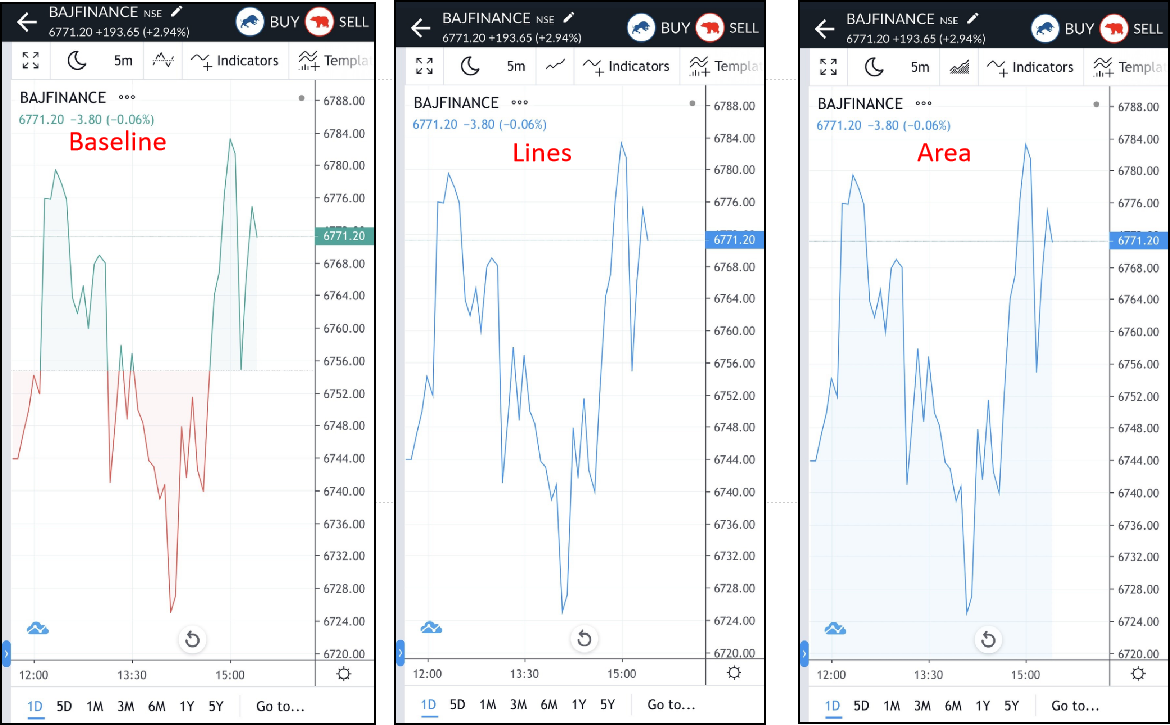
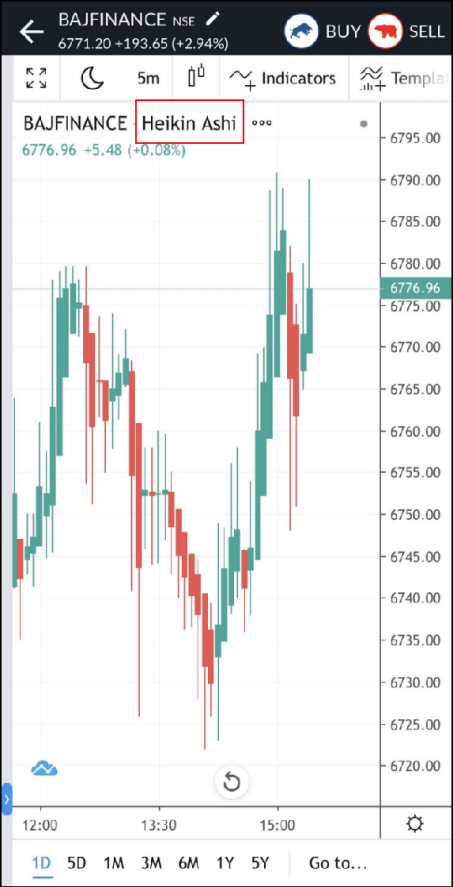
- Chart types
The net change in the price of a stock is represented against the timeframe along the X and Y axes. This can be viewed through different lenses with the help of the following chart types:
-
- Area and Lines
- Candles
- Bars
- Baseline
- Hollow Candles
- Heikin Ashi
and many more

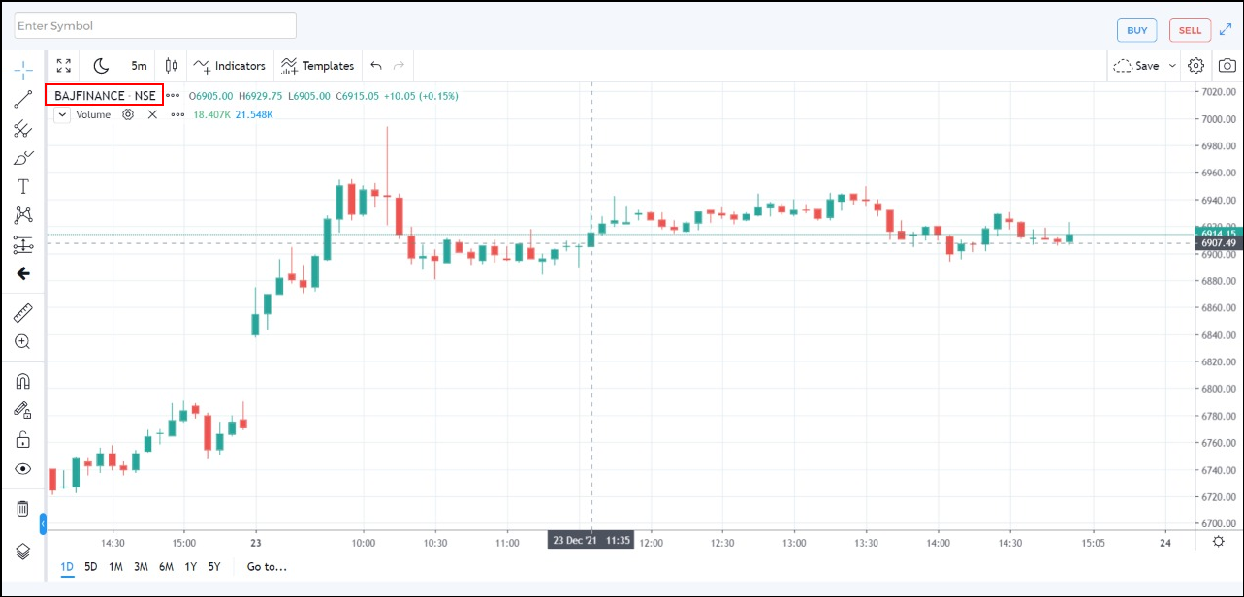
- Stock symbol and Exchange
On the top left of any chart you can see the stock symbol of the company and the name of the exchange on which it trades (optional).
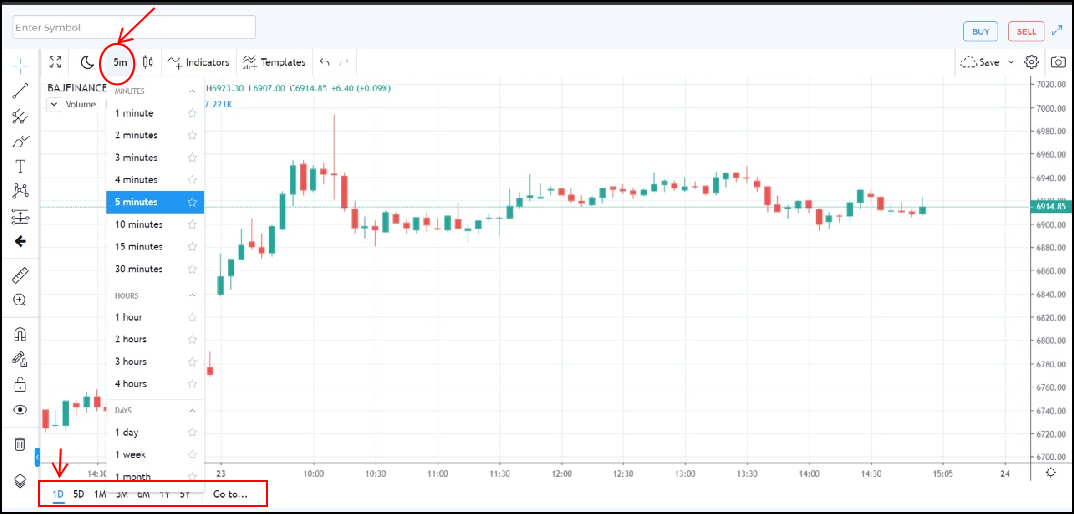
- Chart Period
The stock chart comes with options to study the price movements of stock across different timelines varying from minutes and hours for an intraday trader to days, months, etc for a long-term investor.
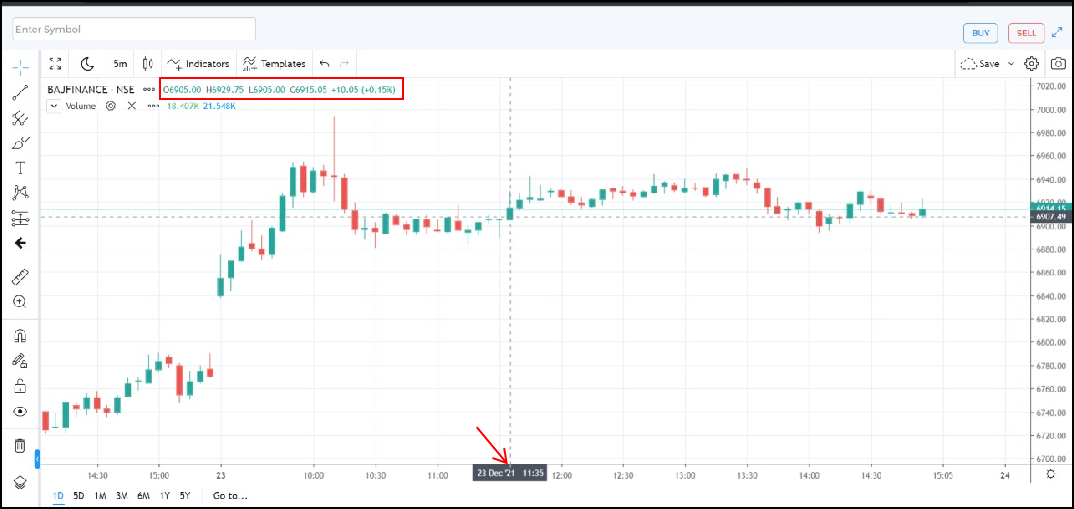
- OHLC data
On hovering the cursor or ticker over a candle/stick/bar on a particular time frame, you can see the display of the following prices of the stock for that time-frame
-
- Open Price (O)- The price of the share at the beginning of that time frame
- High Price (H)-The highest price reached by the share during that time frame
- Low Price (L)-The lowest price reached by the share during that time frame
- Close Price (C) - The price of the share at the end of that time frame
-
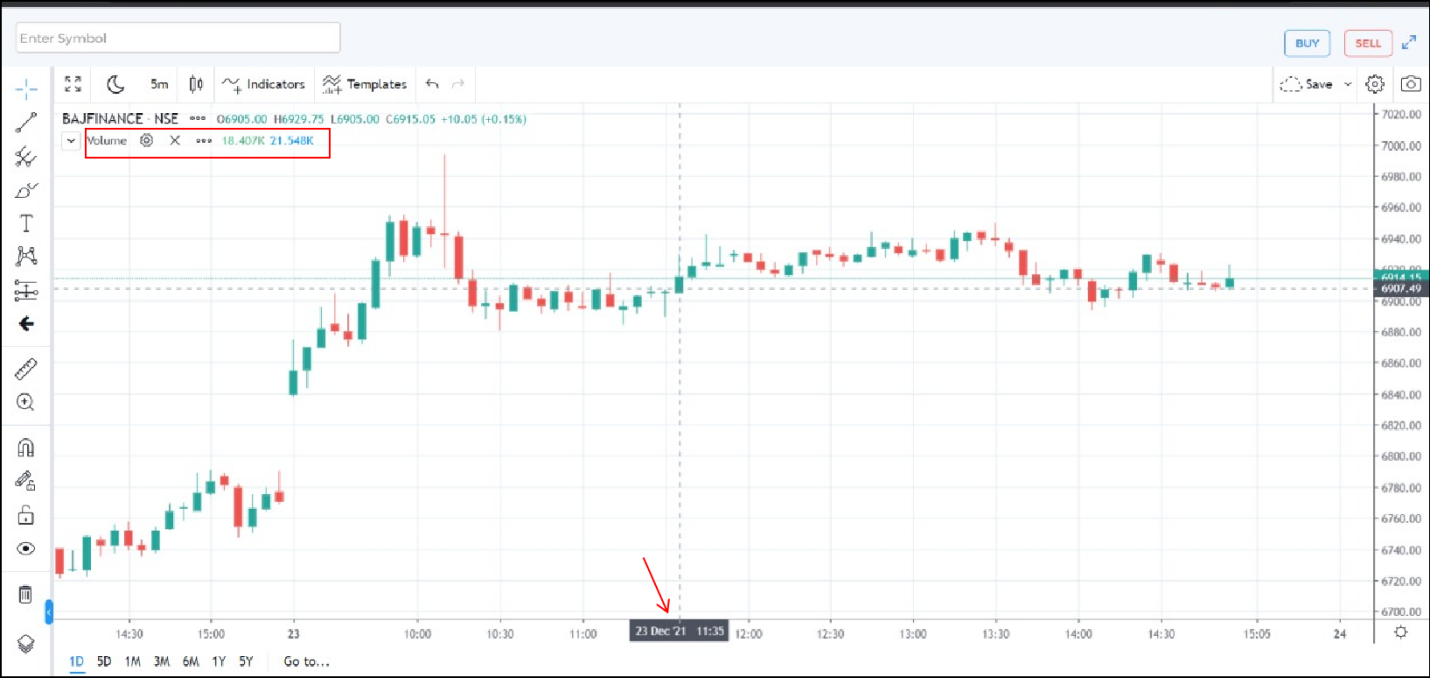
- Volume
The volume of the shares transacted for any given time will be displayed on hovering the cursor over that time frame.
Volume is the number of share units of the stock traded for a given timeframe. It reflects the demand and supply for the stock at that point in time.
-
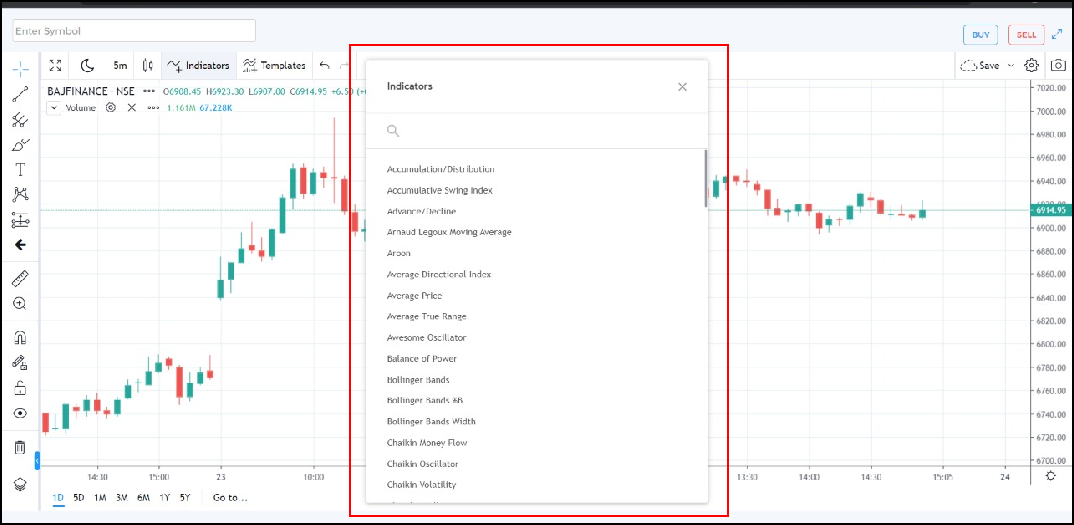
- Indicators
Indicators like Candlestick patterns, Moving Averages, RSI(Relative Strength Index), and many more are used by traders for technical analysis. The masters in trading make use of several indicators to analyse the stock data and place a trade on the analyses made.
Now that you know the basics of stock charts, you can start reading the charts for your trading. As you learn well to read the charts, you can make use of the different indicators for an in-depth analysis of stock data. Learn how to access the charts on Angel one here.
Learn Free Stock Market Course Online at Smart Money with Angel One.
Disclaimer: The securities quoted are exemplary and are not recommendatory.
