
You must study financial ratios, balance sheets and profit and loss (P&L) accounts while doing fundamental analysis. On the other hand, there is another method that can help you anticipate the movement of a stock with the support of price and volumes. This is known as technical analysis. The study provides tools to navigate the gap between intrinsic value and market price through a systematic approach to understand market behaviour. Below are key indicators that can help market participants to take the price action successfully and with efficiency.
Moving averages are used to identify trends in the markets. A rising average would mean a bullish trend, while a falling moving average would mean some weakness in the trend. Moving averages are calculated by price data points. In general, a 50-Day Moving Average (DMA) is used to identify a short-term trend, whereas a 200-Day Moving Average is identifying a long-term trend.
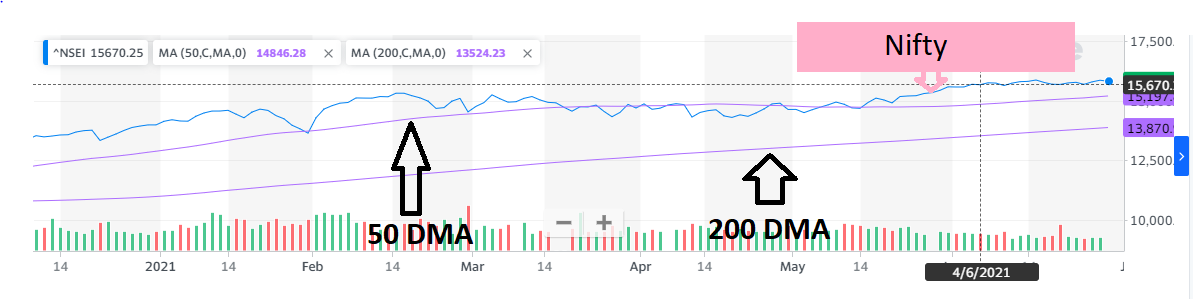
Here Nifty is trading above its 50-DMA and 200-DMA. This indicates a strong uptrend in the domestic equity market.
Exponential moving average (EMA) and simple moving average (SMA) are the two most popular types of moving averages. The only difference between the two is that an SMA would give equal weight to all days, whereas an EMA would give more weight to more recent data points. In short, moving averages go into the foundation of making many other momentum indicators and oscillators.
Moving Average Convergence Divergence or MACD is a momentum oscillator. It is one of the most simple momentum indicators. However, the indicator is a lagging momentum indicator and is made using two exponential moving averages. The main MACD line is the difference between 12-day EMA and 26-day EMA. Then, there is a signal line which is a 9-day EMA of the MACD line.
Signal line crossovers are the most basic interpretation of MACD indicators. An upward or bullish crossover occurs when the MACD crosses above the signal line. A bearish crossover occurs when the MACD crosses below the signal line. The indicator should not be used in isolation. You should also use this indicator with others like moving averages, relative strength index, Bollinger Band among others.
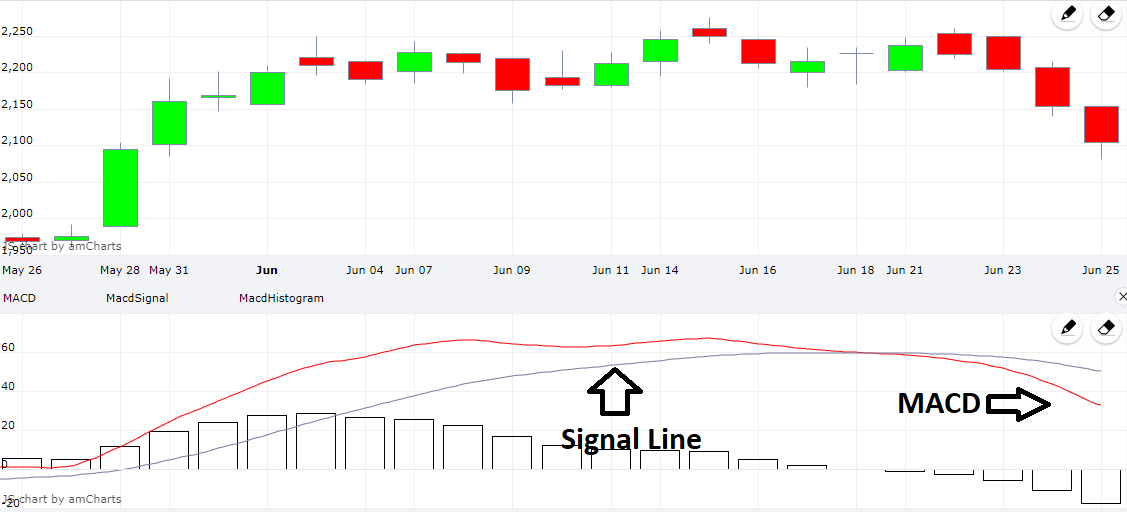
The above chart of Reliance Industries shows that the scrip is trading below the signal line, indicating a bearishish crossover.
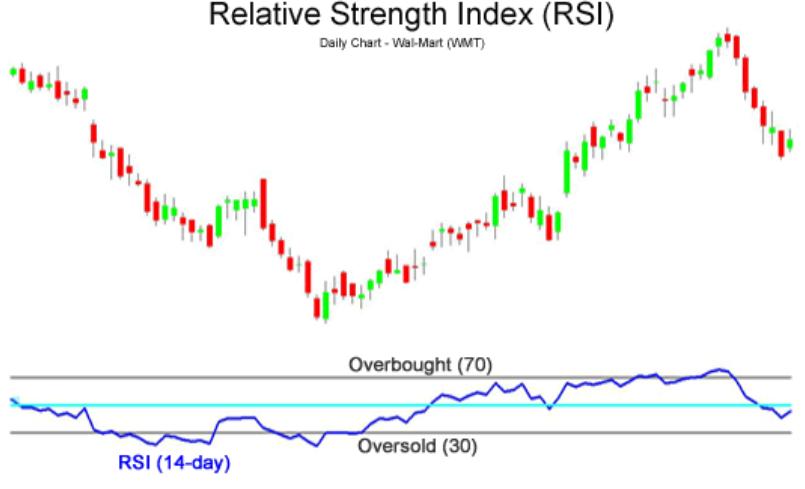
Relative Strength Index, or RSI, is a momentum indicator that measures the speed and change of price movements of a stock against its own self over a period of 14-day. RSI shows the development of patterns much ahead of the actual price. Being a leading indicator, it is a price that follows the momentum of this indicator. The index moves between 0 and 100. It is considered as overbought when the value moves above 70 and below 30 is considered as oversold.
Developed by John Bollinger, Bollinger Bands is an “overlay” indicator and plotted on the price scale. Based on the standard deviation, they change, that is increase and decrease as the volatility increases or decreases. They are volatility bands, placed above and below a moving average; default being a 20-period SMA. The default parameters of construction of a Bollinger Band is two bands each of 2 Standard Deviation, placed above a 20-period Simple Moving Average. They can be used to determine if prices are relatively high or low. According to its creator, the bands should contain 88-89% of price action, which makes a move outside the band a significant event.
The primary use of this tool is to identify M-Bottoms, W-Tops, and any onset of new breakout depending upon the price closing above or below the band.
However, it is also important to note that Bollinger bands are not supposed to be used in isolation. The indicator should be used with other technical tools for confirmation of the trend.
On Balance Volume (OBV) is one of the crucial technical tools which measures volume indicators. It measures buying and selling pressure as a cumulative indicator. It will add volume on up days and subtract it on the down days. OBV is used as a leading indicator because volume precedes the price action.
A reading based on OBV can be done by identifying divergences. Bullish and bearish divergences can be used to identify a potential trend reversal. You can identify the bullish trend when positive volume is more than negative volumes and the OBV rises. On the other hand, selling pressure is visible when negative volume exceeds positive volume and the OBV line falls. This tool is also used as a trend confirmation tool.
Aroon Oscillator is nothing but a difference between Aroon Up and Aroon Down. It is calculated as under:
Aroon-Up = 100 x (25 – days since 25-day high)/25
Aroon-Down = 100 x (25 – days since 25-day low)/25
Aroon Oscillator = Aroon-Up minus Aroon-Down
The oscillator helps to identify a beginning or an end of a major trend. When it comes to interpretation, a reading above zero means that Aroon-Up is greater than Aroon Down and this implies that the prices are making new highs more than new lows.
The interpretation of this indicator is pretty straightforward as the difference between Aroon-Up and Aroon-Down will be either positive or negative. A positive or negative threshold can be used to define the strength of the trend.
Published on: Aug 31, 2021, 1:20 AM IST
We're Live on WhatsApp! Join our channel for market insights & updates

Get the link to download the App

