
Who likes to take a guess in a market that changes every minute? The answer is No One!
Every little market move, every tiny tick, has the potential to completely shift your decisions and outcomes. It’s chaos trying to make sense of all that market madness.
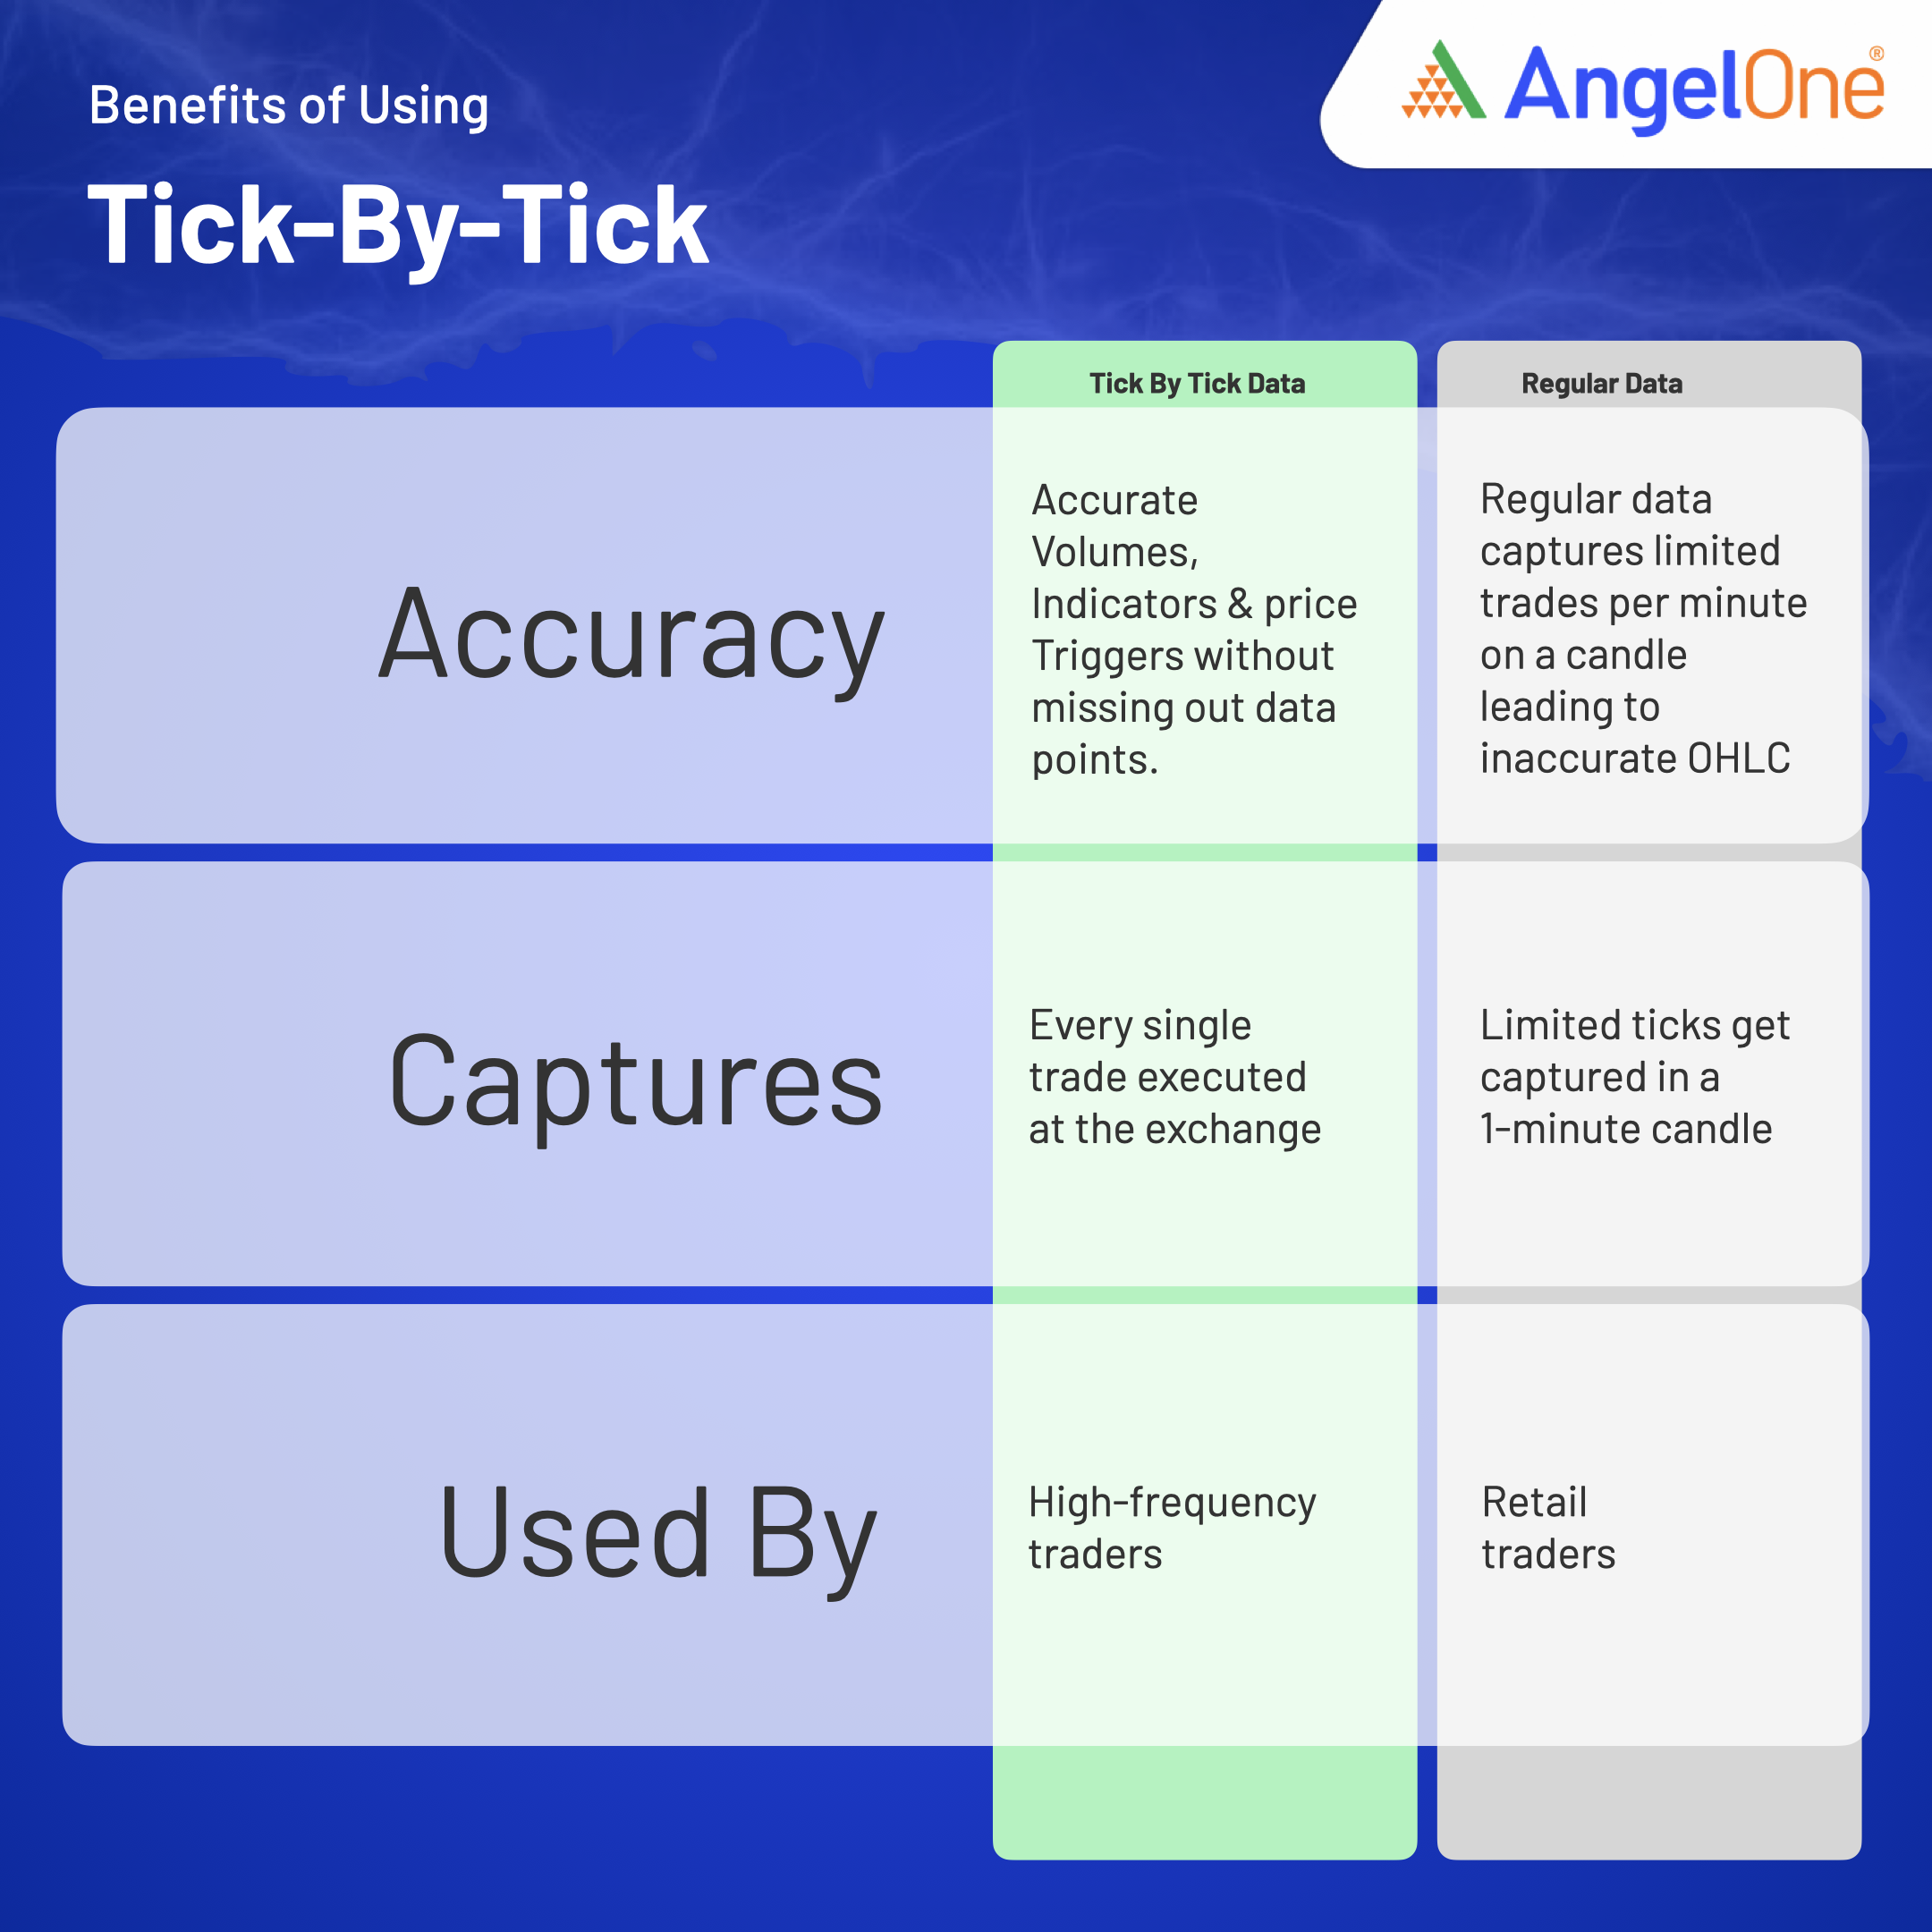
This invaluable service is an exclusive offering, available only through two brokers currently in India. We proudly hold the position as the second provider to introduce Tick By Tick charting, affirming our commitment to innovation and excellence in meeting our customers’ needs. Angel One’s new Tick By Tick charting is a total game-changer, cutting through the noise and bringing much-needed clarity. Ditch the guesswork, see every detail of your trade & Miss nothing.
Tick By Tick flips the script on how you interact with and experience the markets. Instead of mayhem, there’s transparency. Instead of confusion, there’s precision. It’s like getting X-ray vision into the driving forces behind those charts. But what does this newfound accuracy mean for traders? It means that gone are the days of second-guessing, of relying on incomplete data to make crucial decisions. With Tick-by-tick charts, traders can trust that every data point is accounted for, every trend accurately identified. It’s a game-changer for technical analysis, where the slightest deviation can make all the difference.
Let’s tell you in detail on how Tick By Tick gives you more control over trading decisions:
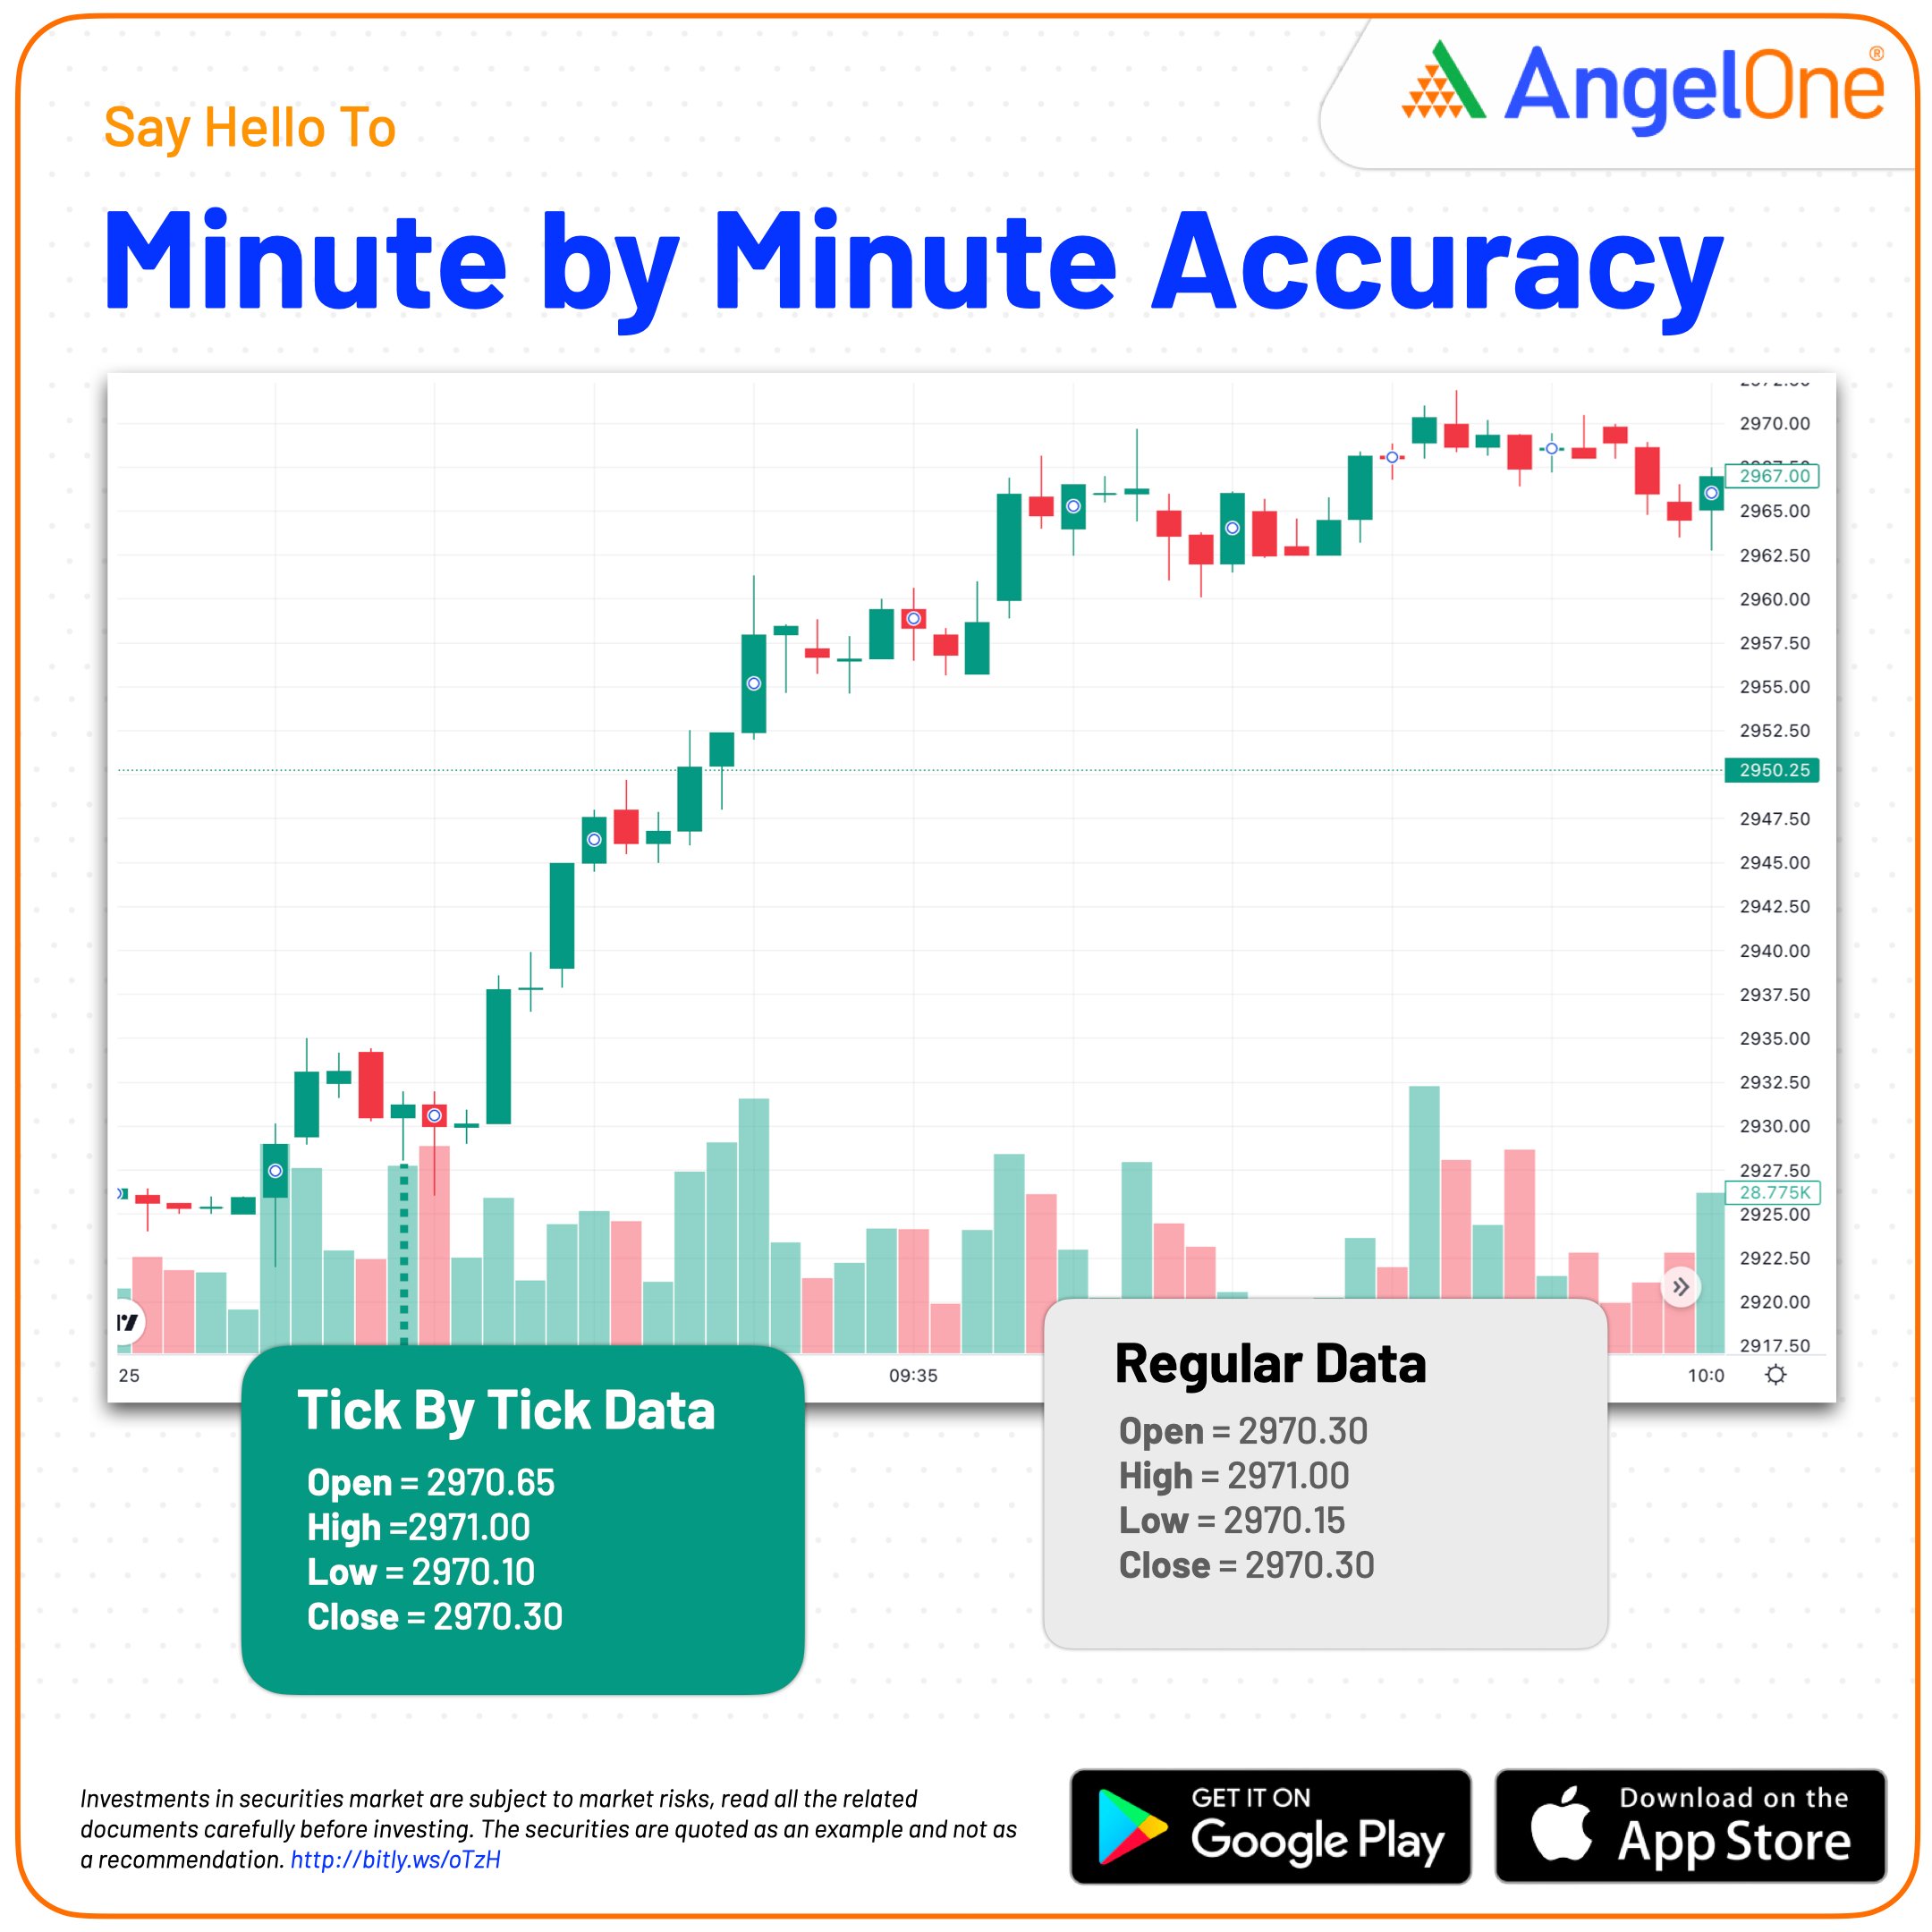
| Tick by tick data | Regular data | |
| Open | 2970.65 | 2970.3 |
| High | 2971 | 2971 |
| Low | 2970.1 | 2970.15 |
| Close | 2970.3 | 2970.3 |
The accuracy of Tick-by-tick charts extends beyond just charting. It permeates every aspect of trading, from identifying patterns to setting price triggers. Traders can rest assured that the indicators they rely on are based on the most precise data available, giving them a competitive edge in the market.
But perhaps most importantly, the accuracy revolution brought forth by Tick-by-tick charts levels the playing field for traders of all backgrounds. No longer is precision reserved for the elite; it’s accessible to anyone with the drive to succeed in the markets. Angel One’s decision to provide free access to Tick-by-tick data is not just a gesture—it’s a commitment to democratizing trading, ensuring that accuracy is within reach for all.
In conclusion, the introduction of Tick-by-Tick Charting Data marks a paradigm shift in the world of trading. It’s a revolution built on accuracy, empowering traders with the tools they need to navigate the markets with confidence. With Tick-by-tick charts, the truth is laid bare, illuminating a path to success that is as precise as it is rewarding.
Published on: Apr 25, 2024, 2:07 PM IST
We're Live on WhatsApp! Join our channel for market insights & updates

Get the link to download the App

