Purpose
The purpose of this section is to give you a clear idea about your portfolio at any given point of time, so that you can track and assess the performance of your portfolio, compare it to other portfolios and tweak it whenever needed.
SECTION WISE DESCRIPTION
Home Page Link
When you open the Home page, you can easily spot the overall details of your portfolio on a dark card on the Home page itself, right below the ‘Market Today’section. Here you can check your –
- Portfolio Market Value - This is the real-time market value of all your assets combined, shown at the top left of the card.
- Hide icon - Clicking this eye-shaped icon will hide all the information in this card and the Portfolio section, except percentage gains or losses. Clicking it again will show all the values again.
- Overall gain (loss) – The difference between market value and the total amount you have invested. The overall gain or loss is shown both in absolute terms and percentage terms).
- Breakup - You will find the overall breakup of your investments in terms of asset types i.e. Mutual Funds, Equity and SGB. The market value of of each category will be shown.
Thereafter, if you click this box (where the above details are being shown) or if you click directly on the ‘Portfolio’ section at the bottom of the page, you will be taken to the Portfolio page.
Super Portfolio
When you click the Portfolio section of the app, you can view your holdings in multiple asset classes. Your portfolio will thus be divided into the following tabs -
- All
- Equity
- Mutual Fund
- SGB
All
You can start exploring your Portfolio from the section titled ‘All’ under your ‘Portfolio’. On top, you will see the summarised performance of your overall portfolio via the following information -
- Total market value of your portfolio i.e. how much cash a buyer has to pay to buy all the assets that you hold on the app.
- Overall gain or loss in the portfolio over time - both in absolute and percentage terms.
- Invested value i.e. the amount of money that you have paid to buy the assets that you currently hold.
- Today’s gain or loss of your entire portfolio - both in absolute and percentage terms.
On the bottom right of the portfolio summary, you will see the option to ‘VERIFY TO SELL’. Basically, if you want to sell equity, you will have to get authorisation by entering the TPIN and enter an OTP for the CDSL i.e. Central Depository Services (India) Ltd, on their website. Once you get authorisation, it remains valid for the day.
Here is the process of verifying to sell:
- Click on ‘VERIFY TO SELL’.
- Click on ‘PROCEED’.
- Enter your TPIN. It will probably be available on your registered email’s inbox.
- Enter the OTP sent to your registered mobile number or email.
Below portfolio summary card, you will see each category of investment i.e. equity, mutual funds and SGB. Each asset category will have the following information below it:
- Your overall gain or loss, both in absolute and percentage terms in each asset category.
- The invested value and current value of your investments in that category. Invested value is what you paid to obtain those assets. Current value is what others must pay to buy your assets at the current market prices.
- In case you have not invested in anything under that category, you will see a button saying ‘GET STARTED’. Clicking it will take you to the page related to that asset where you can find assets from that category that you can buy.
Finally, at the bottom, you have direct links to:
- Trades and Charges
- Profit and Loss
- Active Mutual Fund SIPs - Takes you to the ‘SIPS’ page of the mutual fund section of the app.
- Active Stock SIPs - Takes you to the ‘Stock SIP’ section of the Orders section of the app.
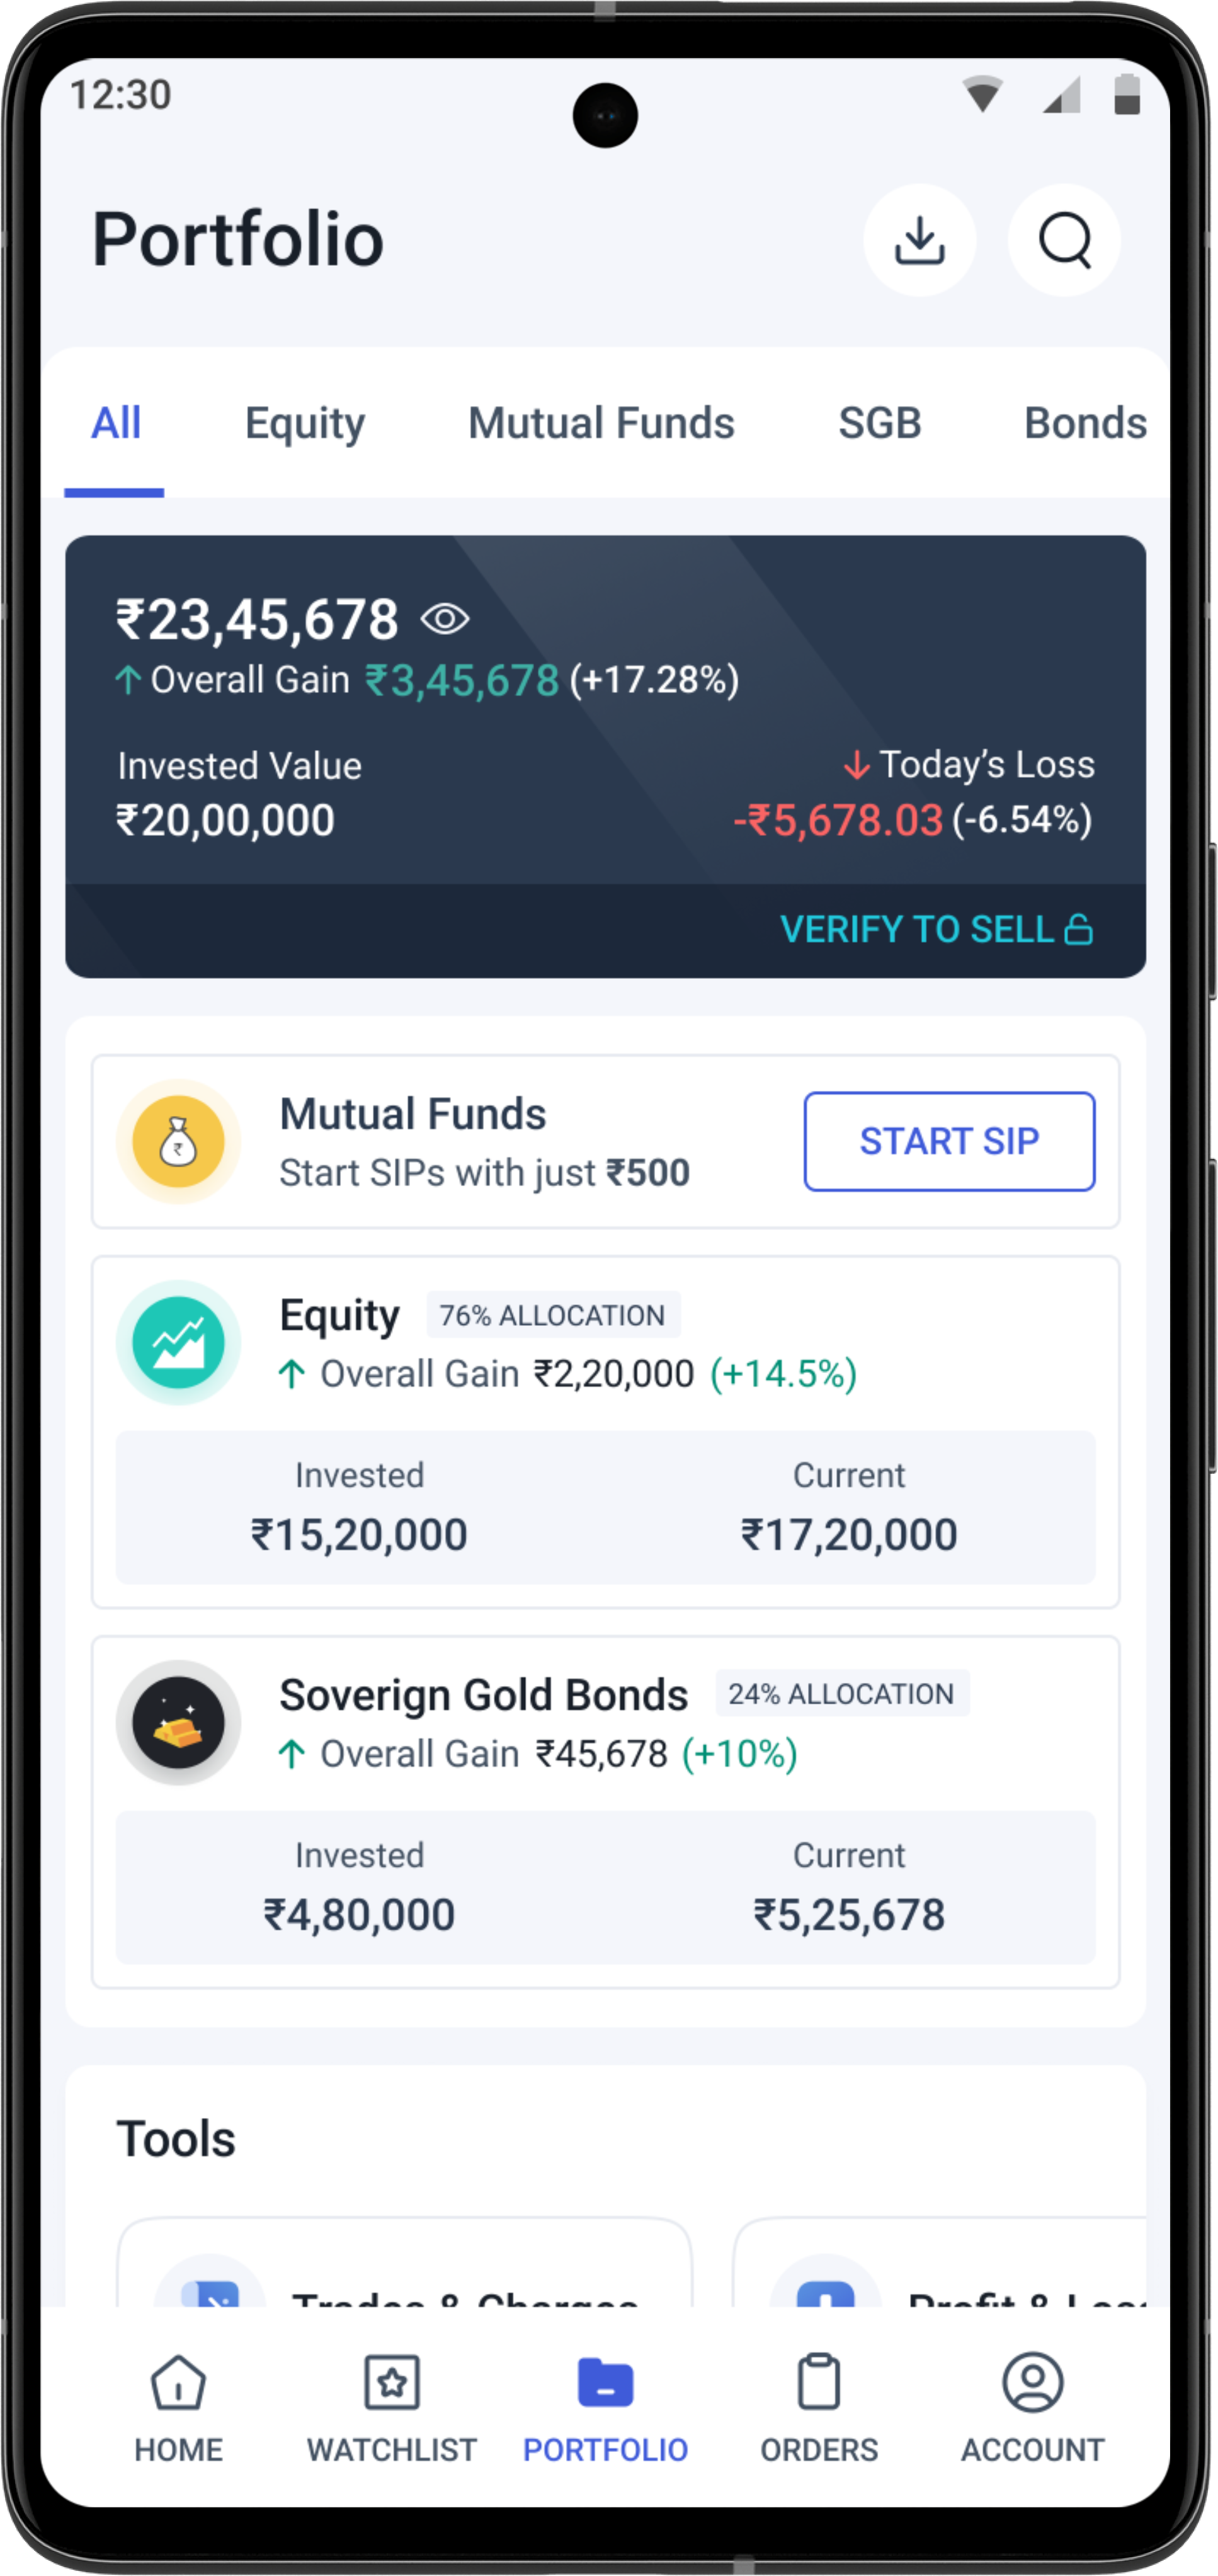
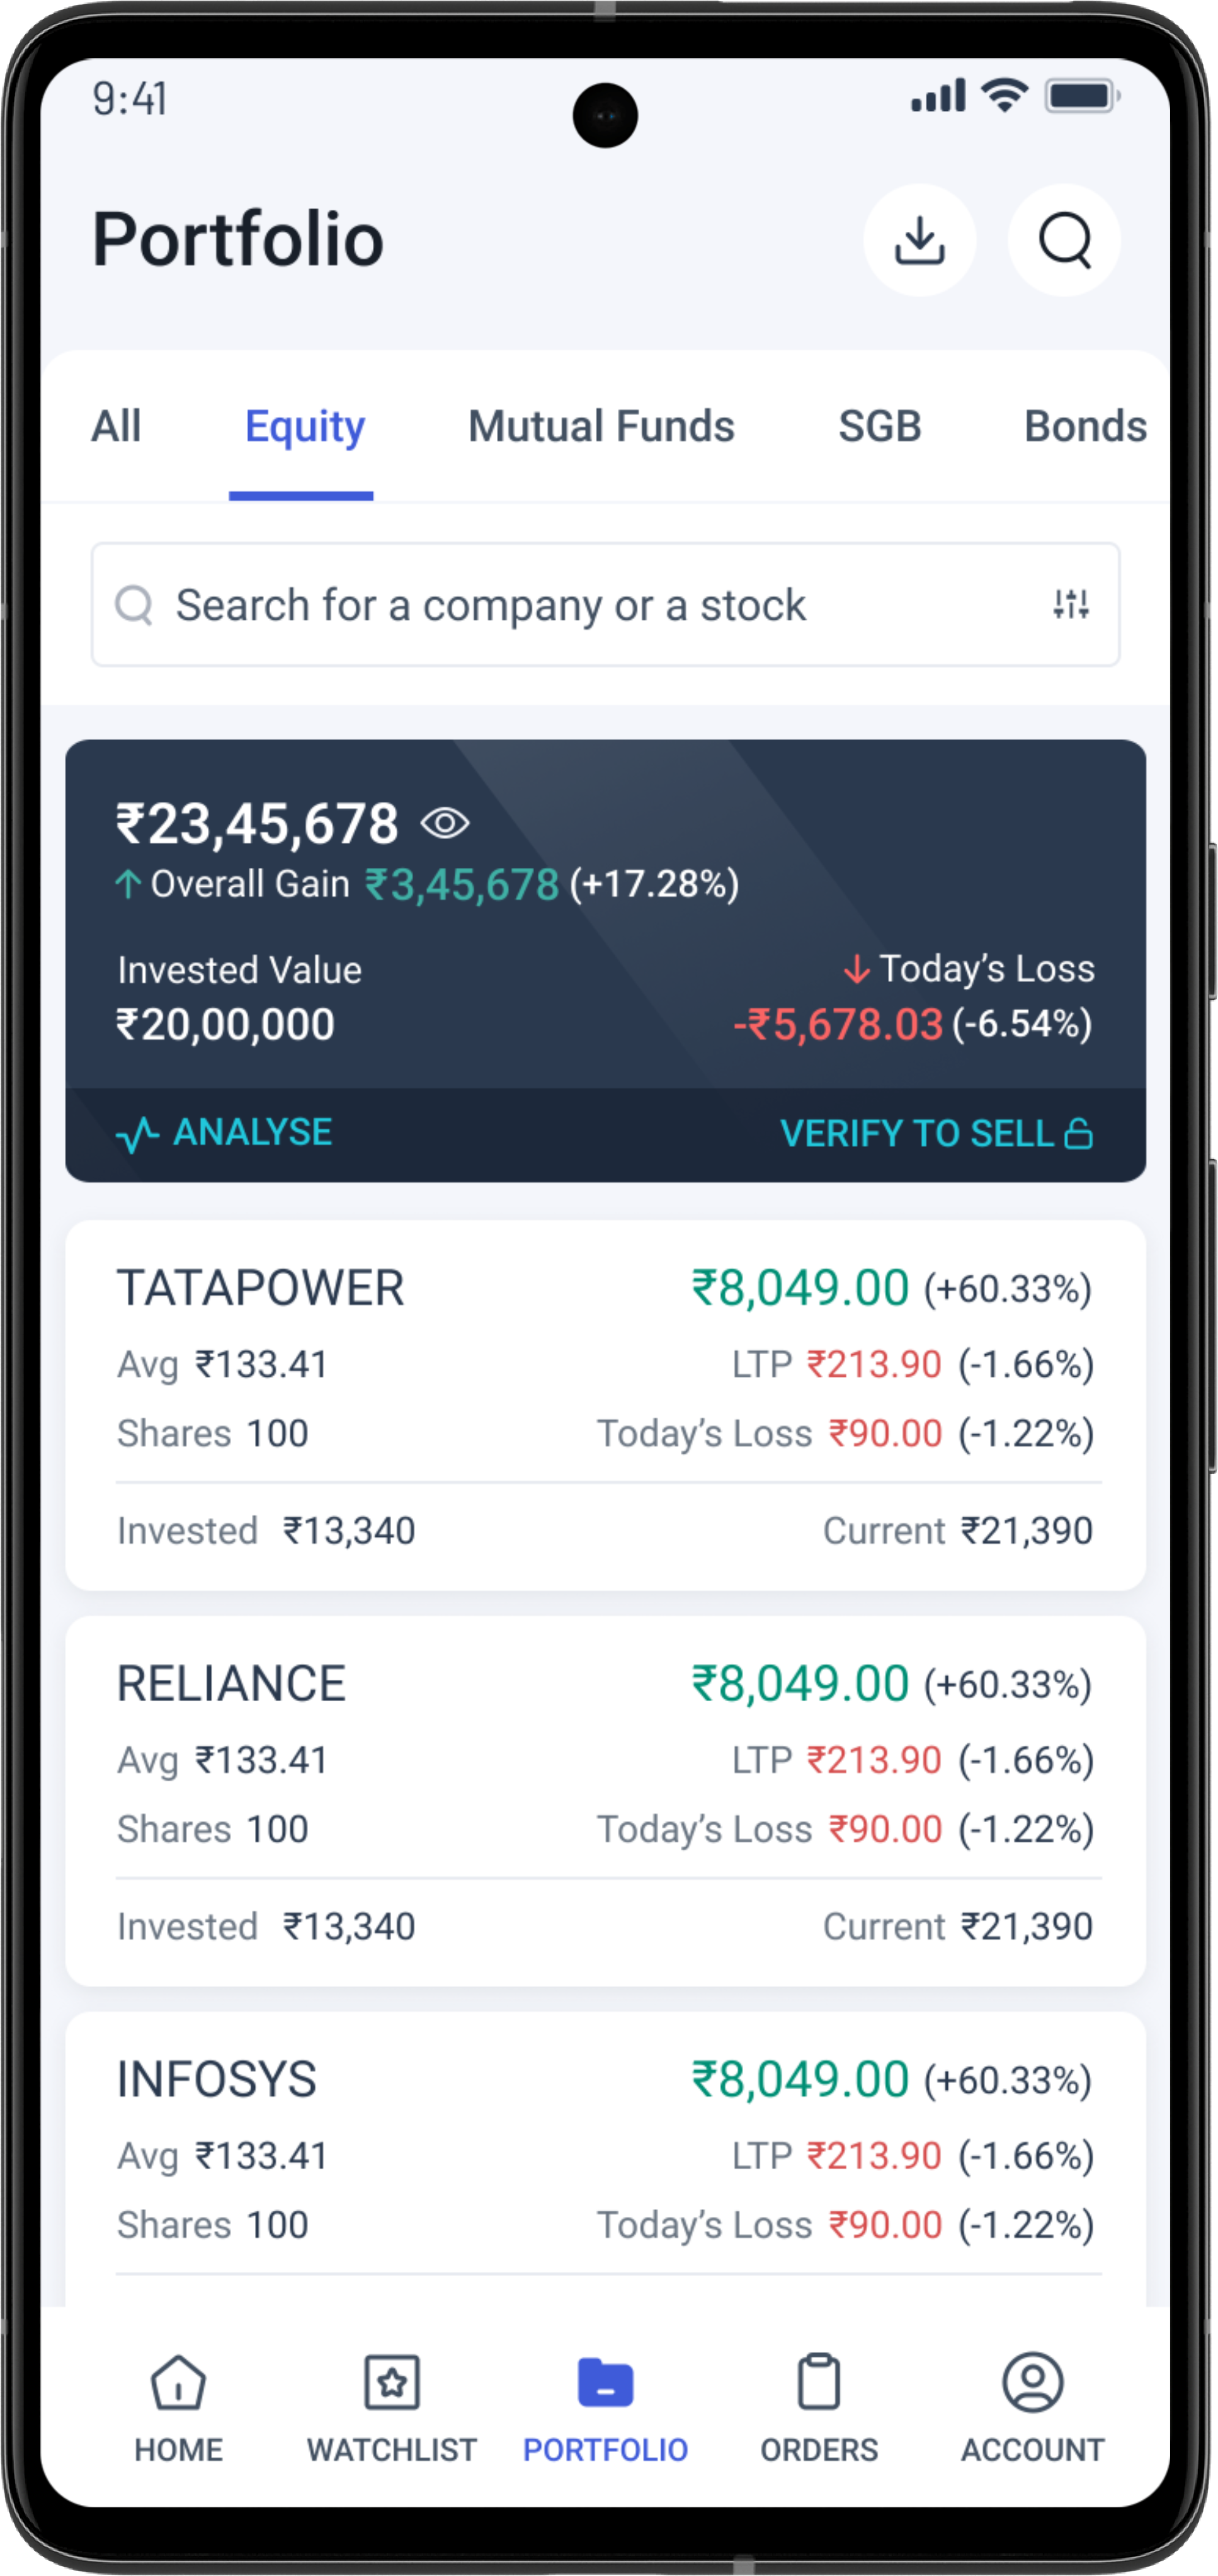
Figure: Initial Portfolio screen under the ‘All’ tab along with quick links under ‘Tools’ (left) and equity holdings page (right).
Equity
From ‘All’, scroll rightward to reach the ‘Equity’ page which lists all the stocks that you ordered to be delivered to your demat account. This means, if you place a trade today under Delivery mode, it will reflected on your portfolio page immediately. In case you have placed an Intraday order, then that asset will not be reflected on your Portfolio page.
Once you open the ‘Equity’ page, you will see on top a dark box showing the following values related solely to your equities -
- Market value of your equity investments
- Overall gain or loss in both absolute and percentage terms
- Invested value, i.e. amount that you have paid to own the equity assets held by you
- Today’s gain or loss i.e. by how much absolute and percentage value has your equity holdings gone up or down in value since the closing of the previous trading day.
Below the box, you will see each of the companies whose stocks you have bought. Next to each name, you will see the following information –
- Number of shares you bought of the company (suppose it is X) multiplied by the average of the prices you bought those shares at (suppose it is Y). Therefore, you will see “X ✕ Y”. Performing that multiplication will give you the total money you have spent to acquire all those shares in that particular company.
- Overall gain or loss made from stocks in that particular company, both in absolute and percentage terms. If you have bought 15 stocks of a company, worth ₹500 each, and have made a profit of ₹25 per share on an average, then the overall gain will show as ₹375 and the percentage gain will show as 5%.
- Below it, you will see the LTP or the last traded price of that particular stock. It is basically the current market price of that stock.
- Next to LTP, in brackets, you will see the day’s gains or losses in percentage terms in the share price of that company. So if the value of the share of that company falls by 2% since the closing of the previous trading day, then 2% is what will be shown in the brackets next to the LTP.
You can search the name of any company or stock from the search bar on this page.
You can also put filters on the portfolio list and sort them as per your preference by clicking the sort/filter icon beside the search bar. From the Sort sleeve, you can also activate a detailed view of the stocks, which will show you the following additional variables for each stock -
- Invested value and current value of the stocks bought of the company.
- Today’s gain or loss in both absolute and percentage terms.
You can sort or arrange the list of stocks in the following ways:
- Alphabetical order
- LTP change i.e. the daily positive change in the LTP e.g. if you choose LTP change as high to low, the stock whose price has fallen by 0.9% or risen by 0.5% will come below the stock whose price has risen by 0.7%.
- Overall gain and loss - choosing this as high to low will place the asset which gave the highest overall gain at the top and vice versa. You arrange them both in terms of absolute and percentage overall gain and loss.
- Average buy price
You can filter the list of stocks in the following ways:
- Price movement - You can choose to view only the day’s gainers or losers i.e. even if a stock has made overall gains, if it has lost value that day, it will come under ‘losers’ here.
- Unrealised gain or loss - You can choose to view only those stocks that have made either overall profit or overall loss for you. Note, that profit and loss terms here do not consider the brokerage and other fees or taxes paid as a cost.
- Product type - You can choose to view only delivery or intraday orders.
- Market cap - You can choose to view only small cap, mid cap, large cap stocks.
- Sector - You can choose to view stocks that you have from a particular sector. All the sectors represented in your portfolio will be shown here. For example, if you have one stock from ‘Plastic Products’ and one from ‘Logistics’ then Logistics and plastic Products will be shown as available options in this list. Clicking on Logistics will show you only the stocks of the logistics company.
- Stock type e.g. ETF, equity, etc.
Coming back to the Portfolio dark box, on the bottom left of the dark box, you will find the option to ‘ANALYZE’ your Portfolio and on the bottom right you will see ‘VERIFY TO SELL’. We have already discussed verifying to sell. Let us now discuss the Portfolio Analyser.
Portfolio Analyser
It is important that as your portfolio grows, your ability to track each and every asset of your portfolio as well as tweak the portfolio as per changing circumstances should not decrease.
Therefore, we have for you the Portfolio Analyser which can help you understand the composition of your portfolio in terms of –
- Market i.e. your equity investments categorised in terms of Small/Medium/Large Stocks.
- Sectors i.e. your equity investments categorised in terms of the sector that they are in.
- Top Holdings i.e. showing how concentrated your investments are in your top holdings by market value.
For each category, you will see the current market value of your investment and the unrealised gains and losses you currently have in percentage terms. You can check the proportion of the specific asset types in your portfolio based and their respective performances.
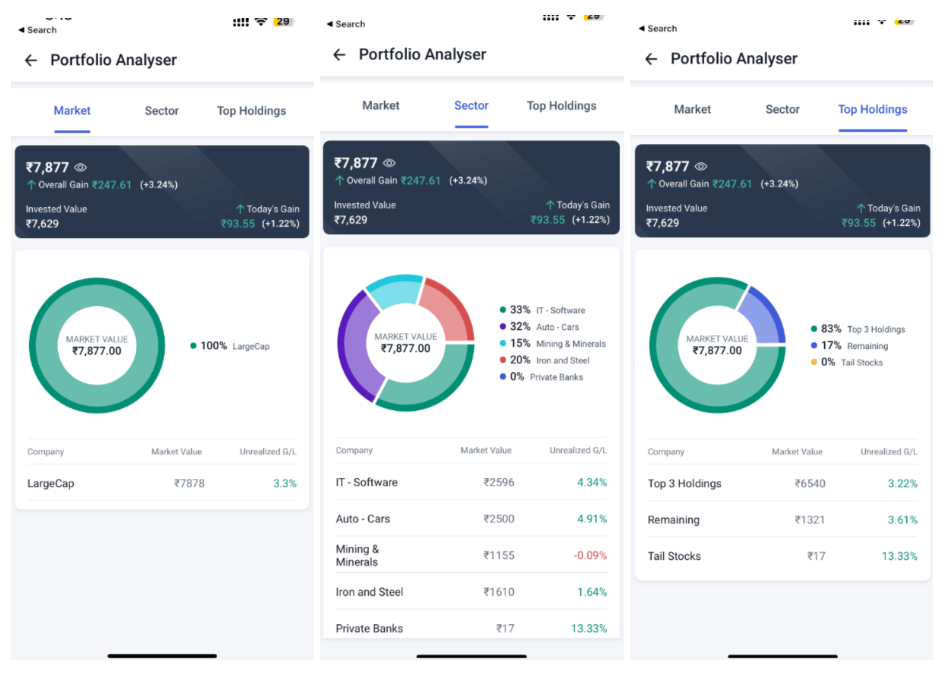
Figure: Portfolio analyser: Market Capitalisation-based analysis (left), Sector-based analysis (middle) and analysis of top holdings (right)
If you click on an individual asset in your portfolio page and scroll down to the bottom, you will see two new, innovative options that we have added – Holdings Breakup and Dividend Earned.
Holdings Breakup will give you the details of your holding, including –
- Quantity of assets bought
- Average traded price at which the trade was made
- Total amount paid/received in that trade
- Date of the trade

Figure: Dividends Earned page (right)
Under the Dividend Earned page, you can view the list of the dividends paid to your account and the date when it was paid. The following information will be visible –
- Date of the payment of dividend
- Total dividend amount received in your account on each individual date (in the list)
- Total dividend earned in the financial year (in the green box at the bottom)
You can change the financial year for which the dividends you are viewing by clicking the required financial year on the top of the page.
Mutual Funds and SGBs
From ‘Equity’, if you scroll right, you will be able to view your Mutual Funds and SGBs.
Mutual Funds
On the top you will see the overall performance of your mutual fund investments, including overall gains and losses, invested value, current market value and day’s gains or losses. Gains and losses are in both absolute and percentage terms.
SGBs or Sovereign Gold Bonds
Similarly, you can see the overall performance of SGBs in the SGB section of the portfolio. This includes the invested value and the overall gains/losses in that particular asset class (including both primary and secondary investments).
How to Hide Your Portfolio Information?
You can get an option on your ‘Portfolio’ page to hide and then unhide all the critical information via a single click. This option will be available on the summary card on your Homepage as well.
When you click the hide ‘eye’ icon in the dark box to hide the information, the following information will be represented with ******:
On the Summary card,
- Invested Value
- Market Value
- Absolute value of unrealised gains/losses (though the percentage change will be visible)
- Absolute value of daily gains/losses (though the percentage change will be visible)
On the Scrip level, all the above data will be hidden, as well as the quantity of assets held (quantity hidden by 3 asterisks *** instead of 5). Also, the asset’s LTP (i.e. Last Traded Price) and percentage changes in both LTP and Unrealised Gain/Loss will be visible.
On Holding details, all the aforementioned data will be hidden, as well as the absolute values of realised gains/losses. However, the percentage value of the realised gains/losses will still be visible.
Similarly, you can hide all the information on your Portfolio Analyser by clicking on the hide ‘eye’ icon.
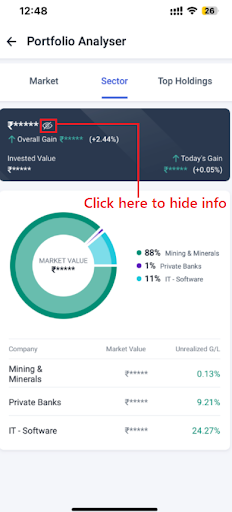
Figure: Hidden information on the Portfolio Analyser
Of course, you can easily click on the unhide button to open up the hidden information. Hiding your details from the home page will also hide those details in the Portfolio page as well and vice versa.
Even while downloading the portfolio, you will be given the choice to download a masked portfolio, whereby the above information will be masked.The Angel One User Manual is your complete guide to navigating our trading and investment platform with ease. Whether you are opening your first Demat account, placing an equity order, setting up an SIP, or applying for an IPO, our step-by-step guides help you understand every feature in detail. From login and dashboard navigation to advanced order types and reports, the user manual ensures you get the most out of Angel One. Designed for both beginners and experienced traders, it brings clarity to every action you take on our platform.
