Purpose
This section acts as an introduction for the user to the world of trading and it is meant to equip the user with as much information and skills as possible before they actually start trading.
SECTION WISE DESCRIPTION
Market Today
The first thing that you spot on the homepage is the section headed “Market Today” - here you can see the daily trends in Nifty and Sensex. If you click on the icon to the right of sensex, you can access the Settings. We will talk more about settings in the Account section.
However, you may choose to replace these indices with some other index that you like. To do so:
- Simply click on the down arrow on the right of the index.
- Choose any two indices you want to track from the given list.
- Click on ‘Save’.
If you click on “View more” under Markets today, you find two sections showing trends in the equity market and the derivative market. On top, you will see the real time data on changes in major market indices.
Equity Market
Here you can see the following data -
- Overall trend of the market e.g. bullish or bearish
- Market movers - This section shows:
- Top Gainers - stocks with the highest % gains compared to their last closing price
- Top Losers - stocks with most % losses compared to their last closing price
- Active by Volume - Stocks with the highest level of trading activity by volume today
- Active by Value - Assets with the highest level of trading activity by value today
Each list can be expanded by clicking on “View All”. There are separate lists for Nifty and Sensex - you can choose them by clicking on the Nifty or Sensex icon on the top right.
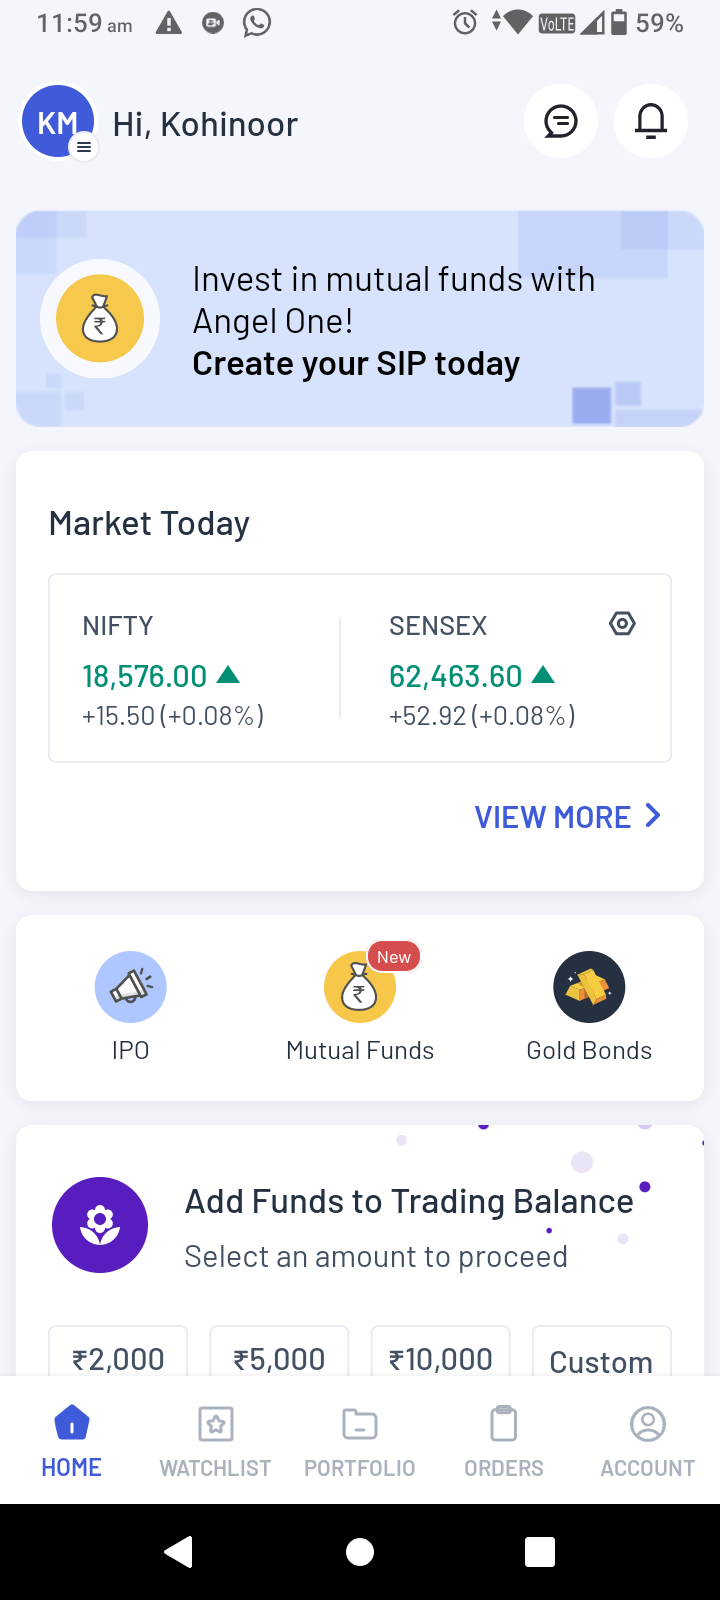
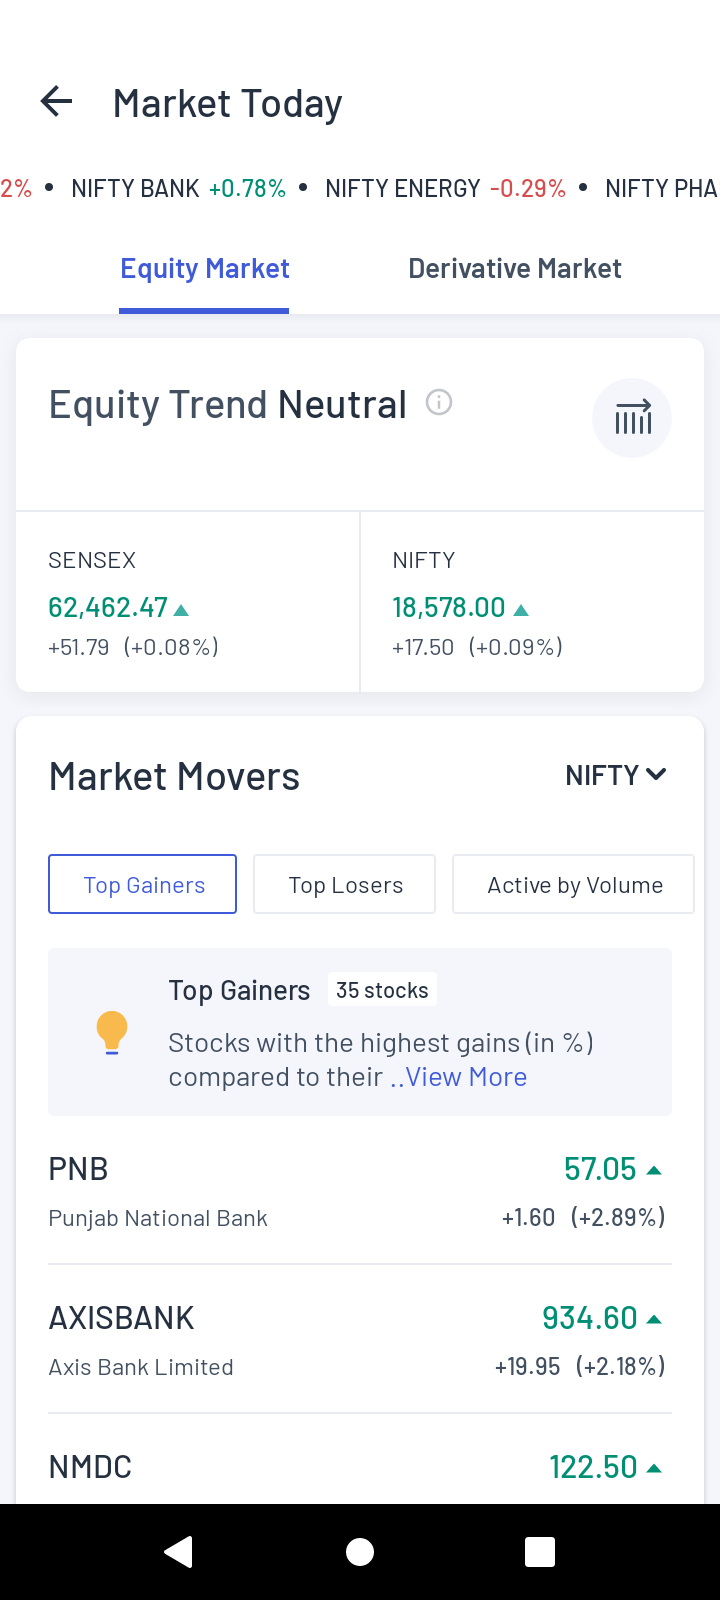
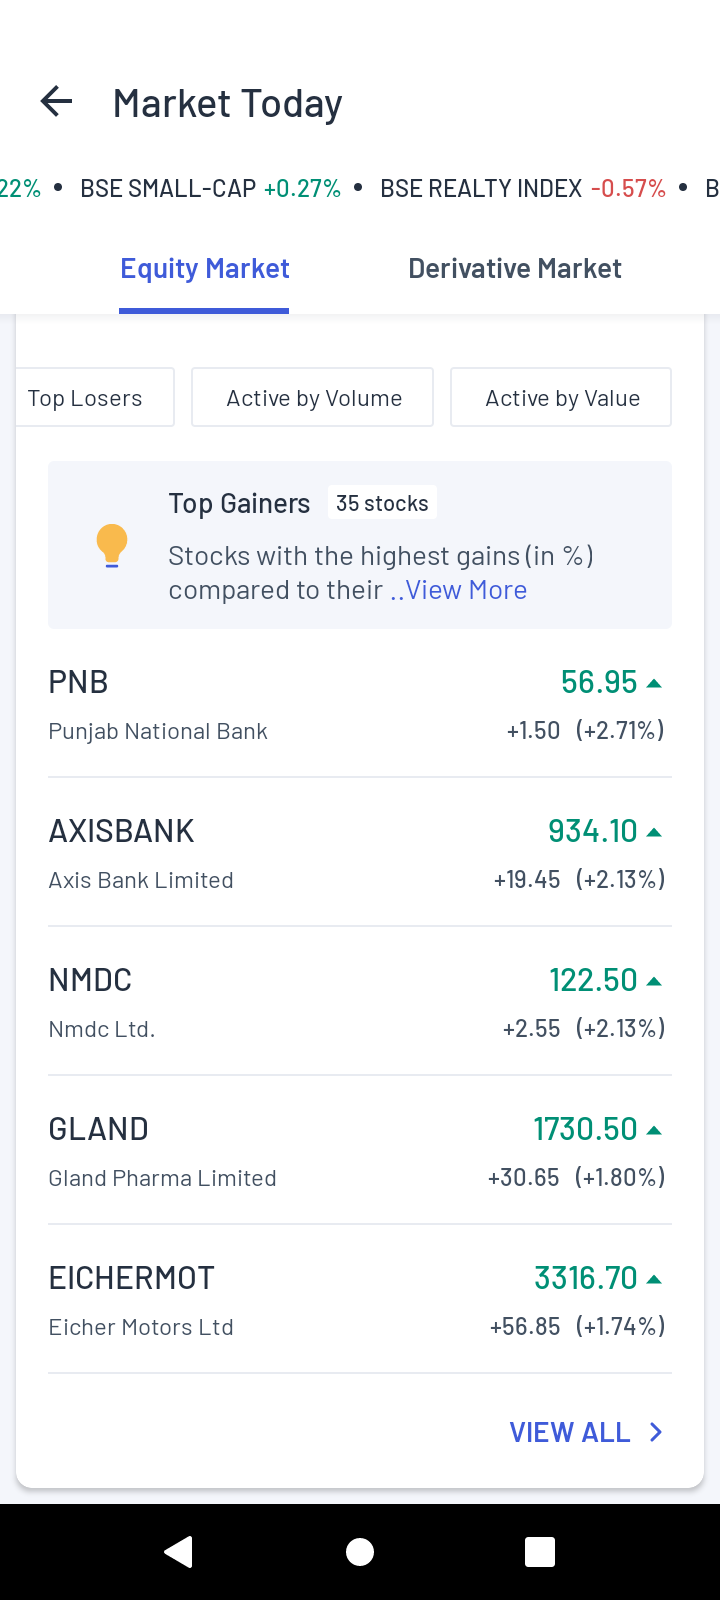
Figure: Spot Market today section (left), click on view more to reach Equity Market (middle and right). Check for market movers e.g. Top Gainers.
Derivative Market
The first thing you will see here are the overall trends in the derivative market e.g. bullish or bearish. You can see the trends in the Nifty and Bank Nifty along with tags identifying trends with more depth e.g. Short buildup, Long unwinding etc.
Thereafter you will see a sectoral heatmap that is colour coded - Darker green means the sector is bullish, lighter green means the sector is stagnant whereas red means the sector is bearish.
Clicking on any of the sectors will give you the list of stocks in that sector - you can add stocks to your watchlist from here directly. You can also click on them to know more about each stock. You can also choose to assort the stocks here as per Price or Open Interest (OI) - simply click on the price or OI icon on the top right. You can also rearrange the stocks as per ascending or descending order in terms of price, open interest or even alphabetically - just click on the “Stock name” on the top left or “Price/Change” or “OI/OI Change” on the top right.
You can also track any major, identifiable trends in the market by checking the “Buildups” section that is right below the section on sectoral heatmaps.
There are 4 types of buildups listed -
- Long buildups - Where new long positions are being created, so price and OI are both increasing
- Short buildups - Where new short positions are created, so price is decreasing but OI is increasing.
- Short covering - Where price is increasing but OI is decreasing as sellers are squaring off their trades by buying
- Long unwinding - Where buyers are selling their long positions so the price is falling and so is OI.
The meaning of each term is explained right below, following which you get a list of assets that are showing that particular trend. You can expand that list by clicking “View All”.
Once you are viewing the entire list, like before (in case of sector wise stocks) you can rearrange the list as per price, open interest and alphabetical order as well as add stocks to your watchlist directly.
Once you scroll down further you can see the following 4 categories of stocks:
- Top gainers - In terms of price increase
- Top losers - In terms of price decrease
- OI gainers - stocks with the highest number of new active contracts, signalling increased market interest.
- OI Losers - Stocks with the highest number of contracts squared off signalling decreasing market interest.
As before, you can click on “View All” to check the entire list - but here you can directly see the list based on Price or OI. Method for reassortment remains the same as before.
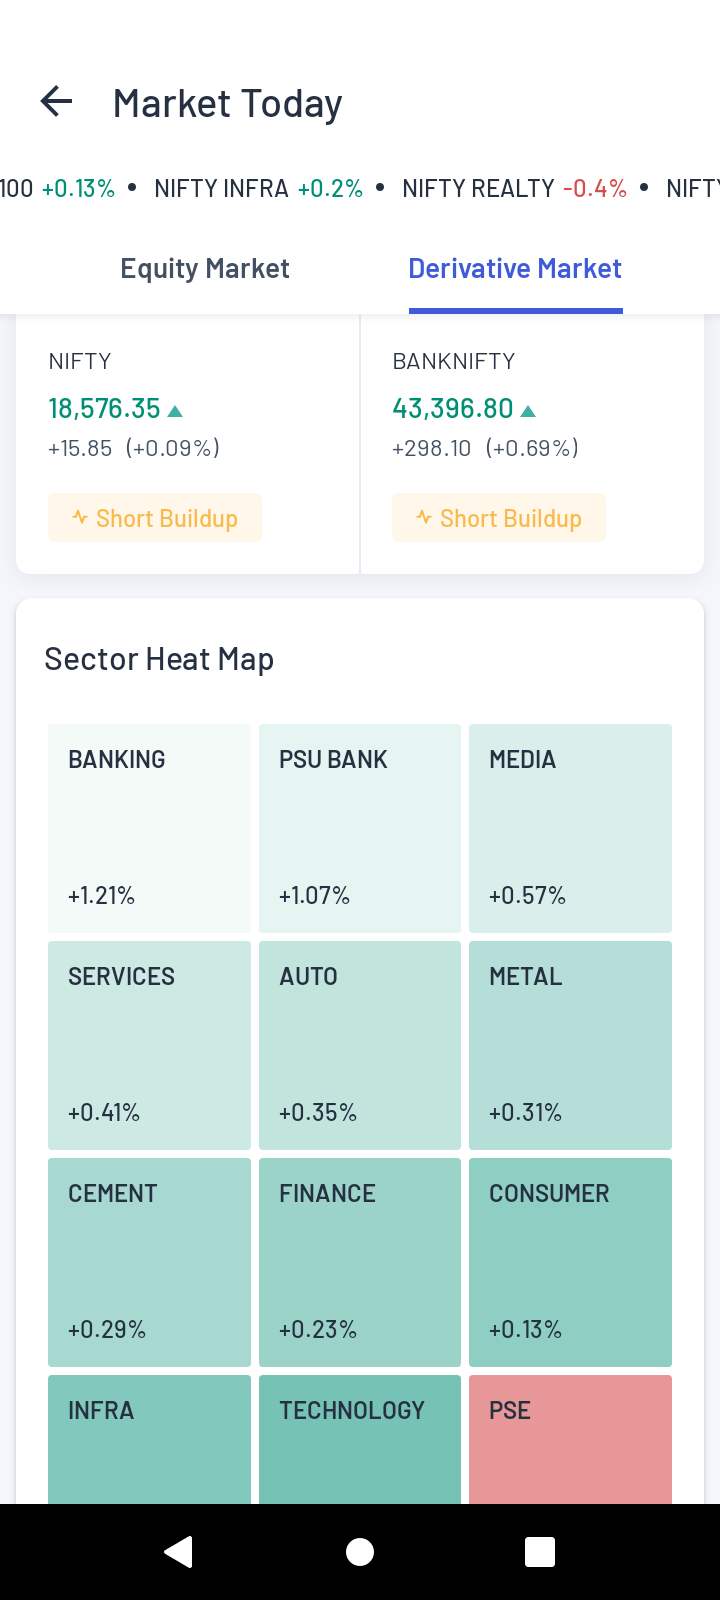
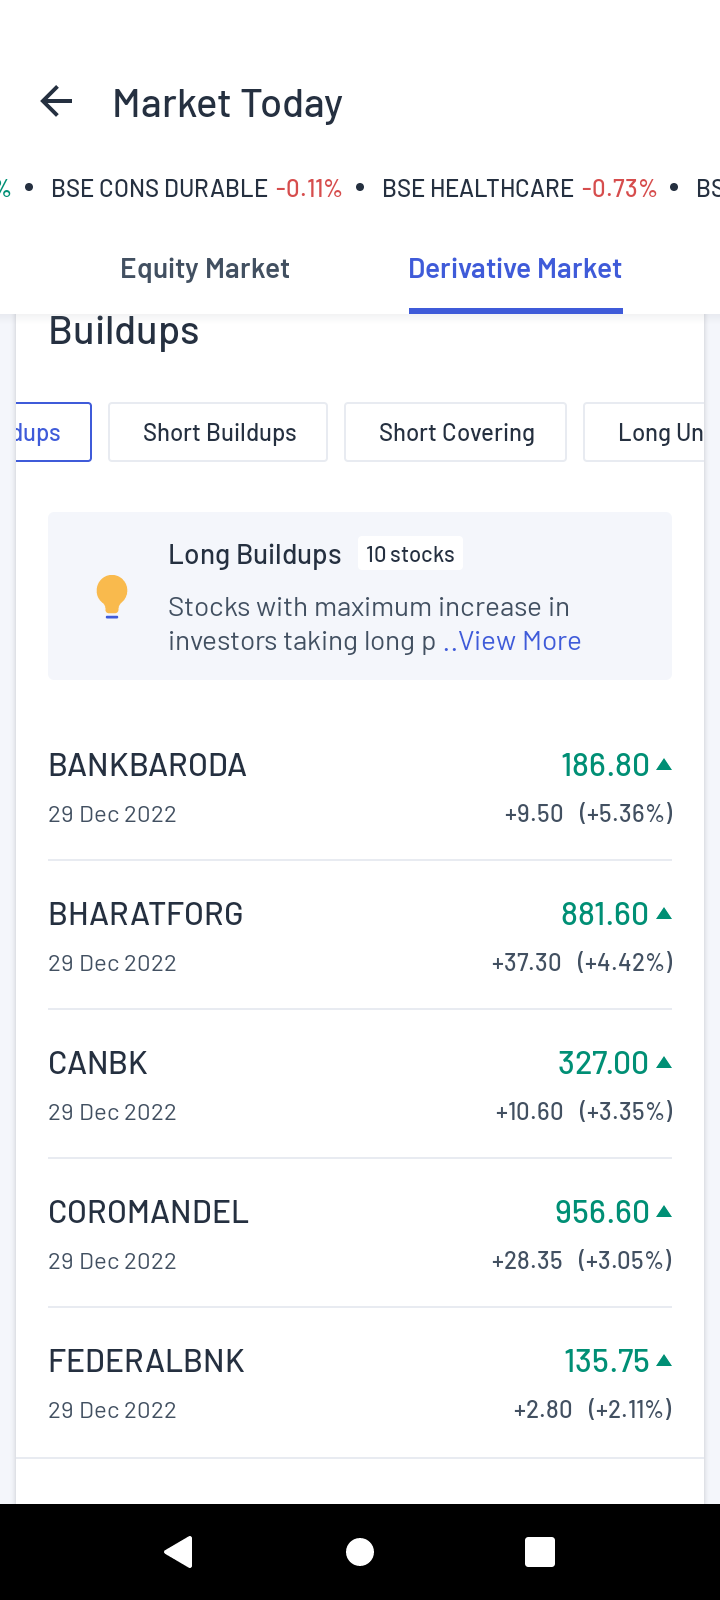
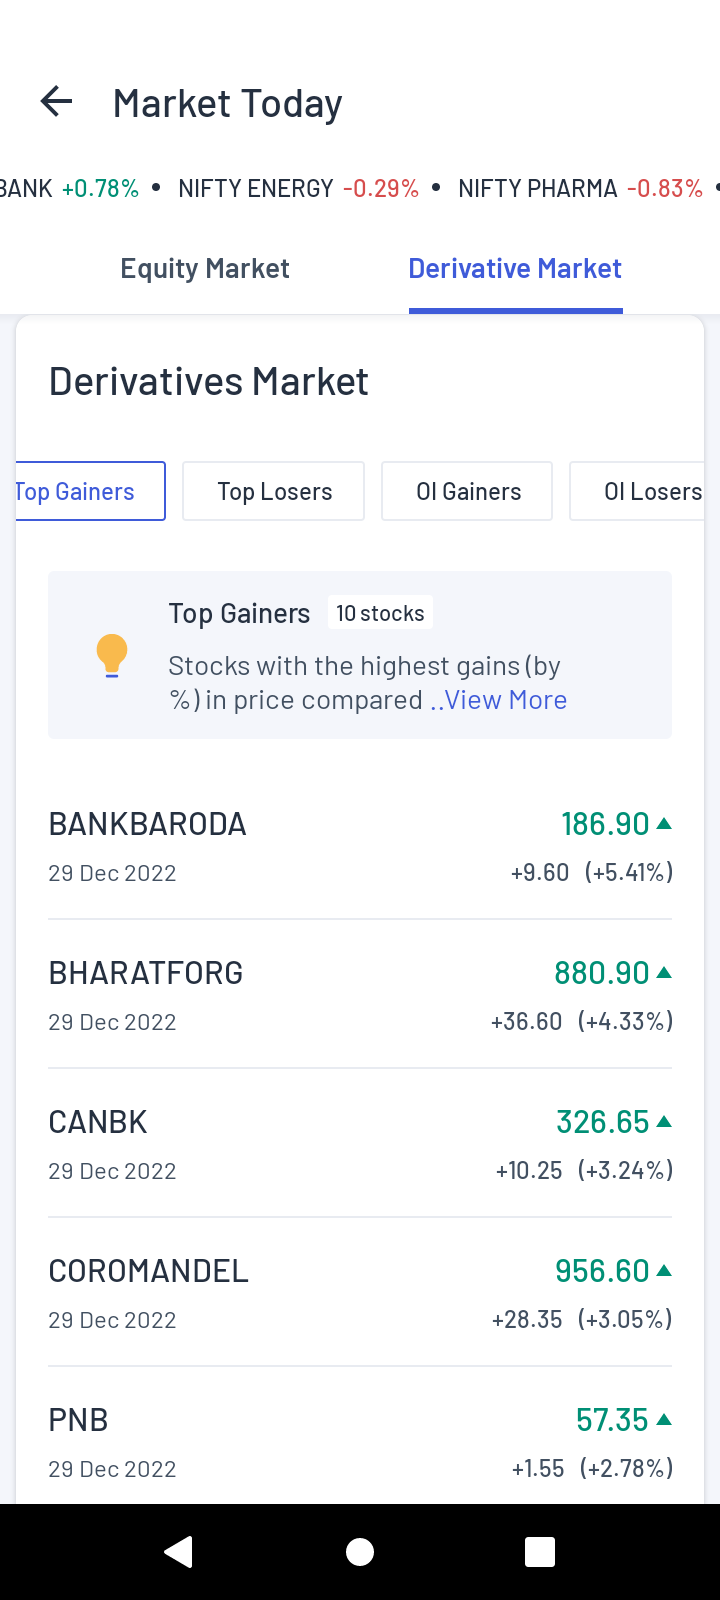
Figure: Derivative market data - Sector Heat Map (left), Buildups (middle), Derivatives Market (right).
Portfolio and Position cards
Right below the indices, you will find a card showing you the performance of your portfolio. On the top left, you will see the current value of your portfolio as well as the overall gains (in both absolute and percentage terms). Below it, you will see the invested amount (i.e. the amount allocated from your funds) and the day’s gain or loss. Clicking this card will take you to your Portfolio page.
In case you have an open position, then to the left of the Portfolio card, you will also see a Position Summary card that will show the gains or losses of your current position. The exact contents of the card include -
- Total Gain/Loss
- Unrealised G/L
- Realised G/L
- No. of Open Positions
Clicking on this card will take you to the positions page. Both of these cards are useful in tracking the performance of your portfolio and your open positions.
Notifications, Alerts, and Announcements
This section contains all your important notifications, market alerts and news that can help you stay up to date about the market. You can reach this section by clicking on the bell icon on the top right of the Home page.
Notifications
Clicking the bell icon will take you to the Notifications page where the notifications related to your transactions and their status will be displayed.
Alerts
If you scroll sideways from the Notification, you will reach the alerts page where you can set an alert for any asset of your choice:
- Simply click on “CREATE ALERTS” which will take you to a search bar.
- Type in the name of your asset, like you do on the regular search bar.
- Once you choose an asset, you can set an alert based on either the price or the volume of the asset.
- The alert can be based on an absolute value that you enter.
- It can also be a percentage value such as 5%, 10% or 15% increase or decrease.
- Once you have set the parameters, click on “CREATE ALERT” to set the alert for that asset.
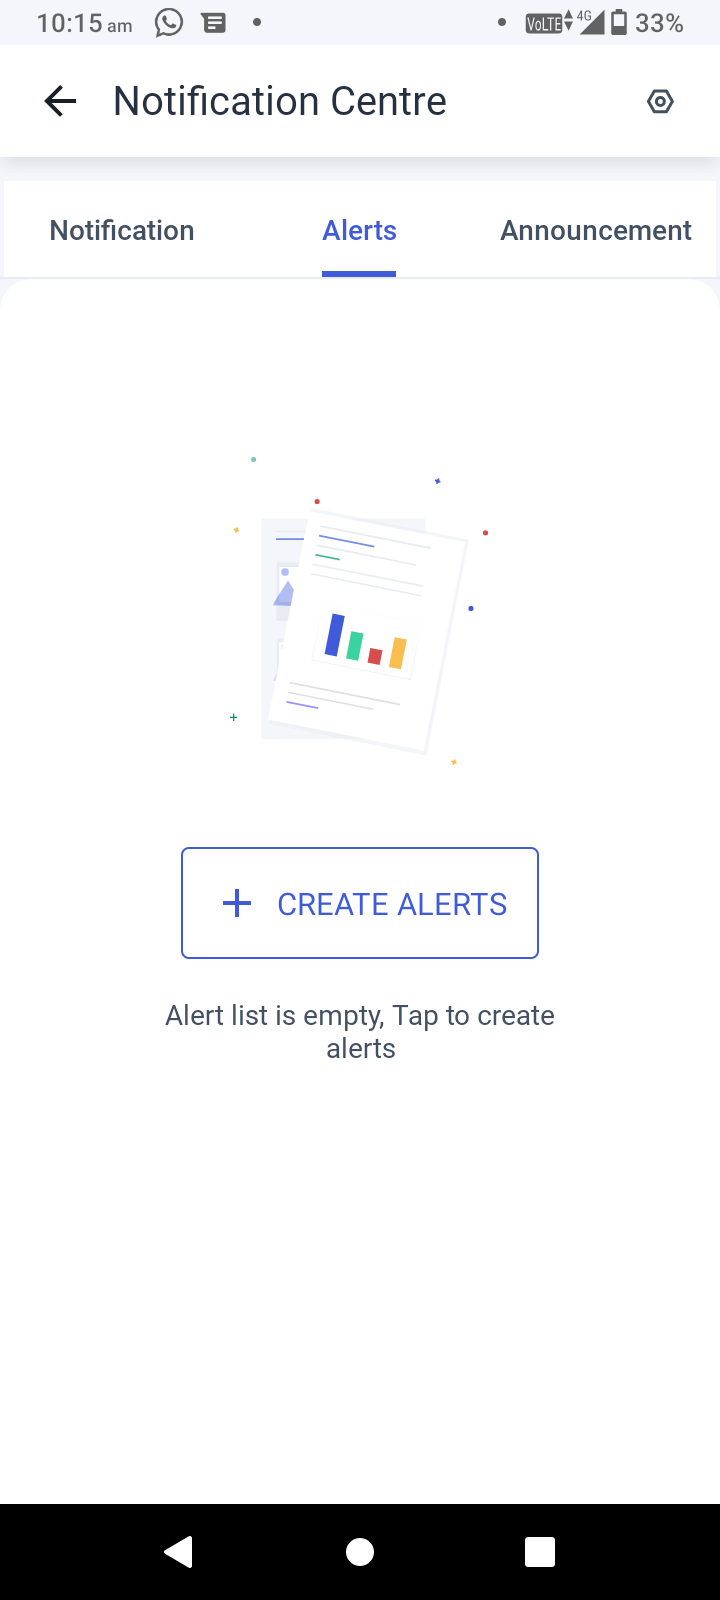
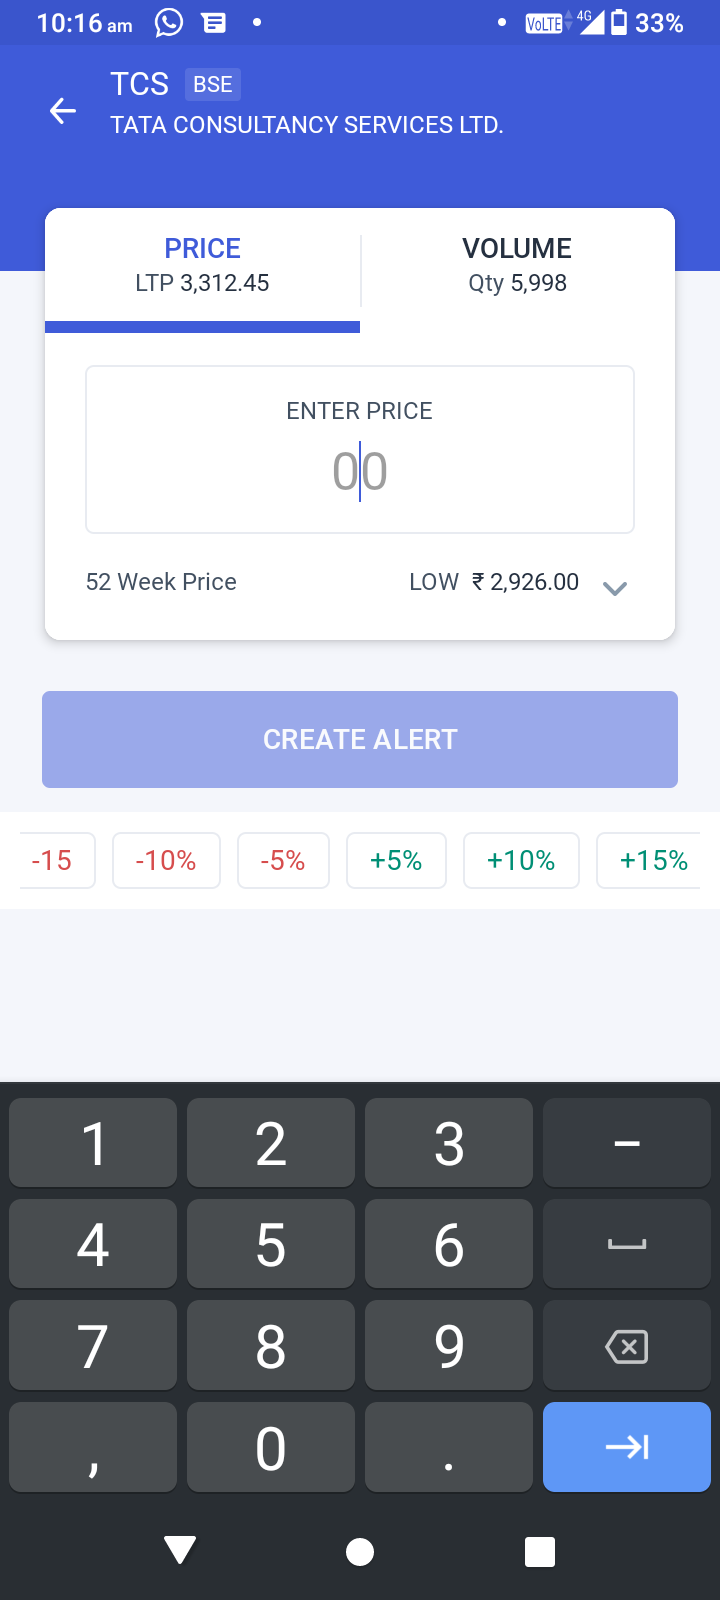
Figure: Create Alerts button (left) and Create Alerts page (right)
Using this feature, you can place up to 25 alerts active at the same time.
You can also create alerts directly from the ‘Stock Details’ section on the asset page.
Announcements
If you scroll further sideways, you will see the announcement section, which contains a list of all the recent market-related announcements. This list may include IPO announcements, changes in the names of companies, new rules of SEBI and a lot more.
IPO
Selecting this icon takes you to the list of open and upcoming IPOs.The list includes upcoming IPOs slated to be launched in a year from now. For each open and upcoming IPO, initially the minimum investment required and price range will be mentioned (as and when the details are available). You can bid at any price of your choice within that price range. Clicking a particular open IPO will give you further information such as:
- Minimum investment (both in terms of money required and number of shares per lot)
- Price range
- Maximum quantity
- Maximum investment
- Discounts (if any)
- Issue size
- ARQ prediction (if not available, then what date it will be available on)
- Important dates (including how many days to bidding)
In addition to the above, scrolling down further will show you important details about the company provided under the following sections:
- About Company - This includes a general overview of the company, its products and infrastructure
- Strengths and Risks
- Youtube video link (if available)
- Download link to the Red Herring Prospectus of the company
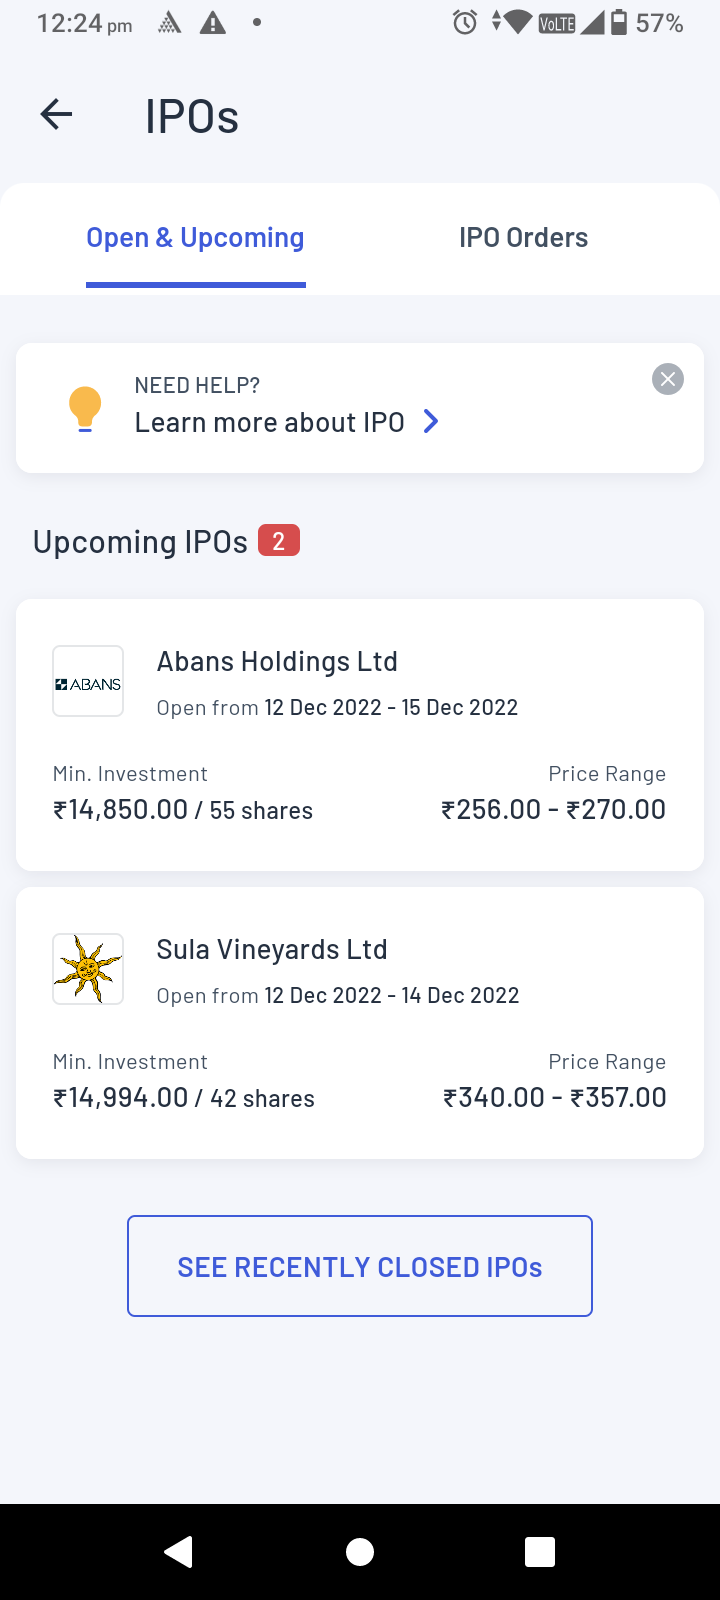
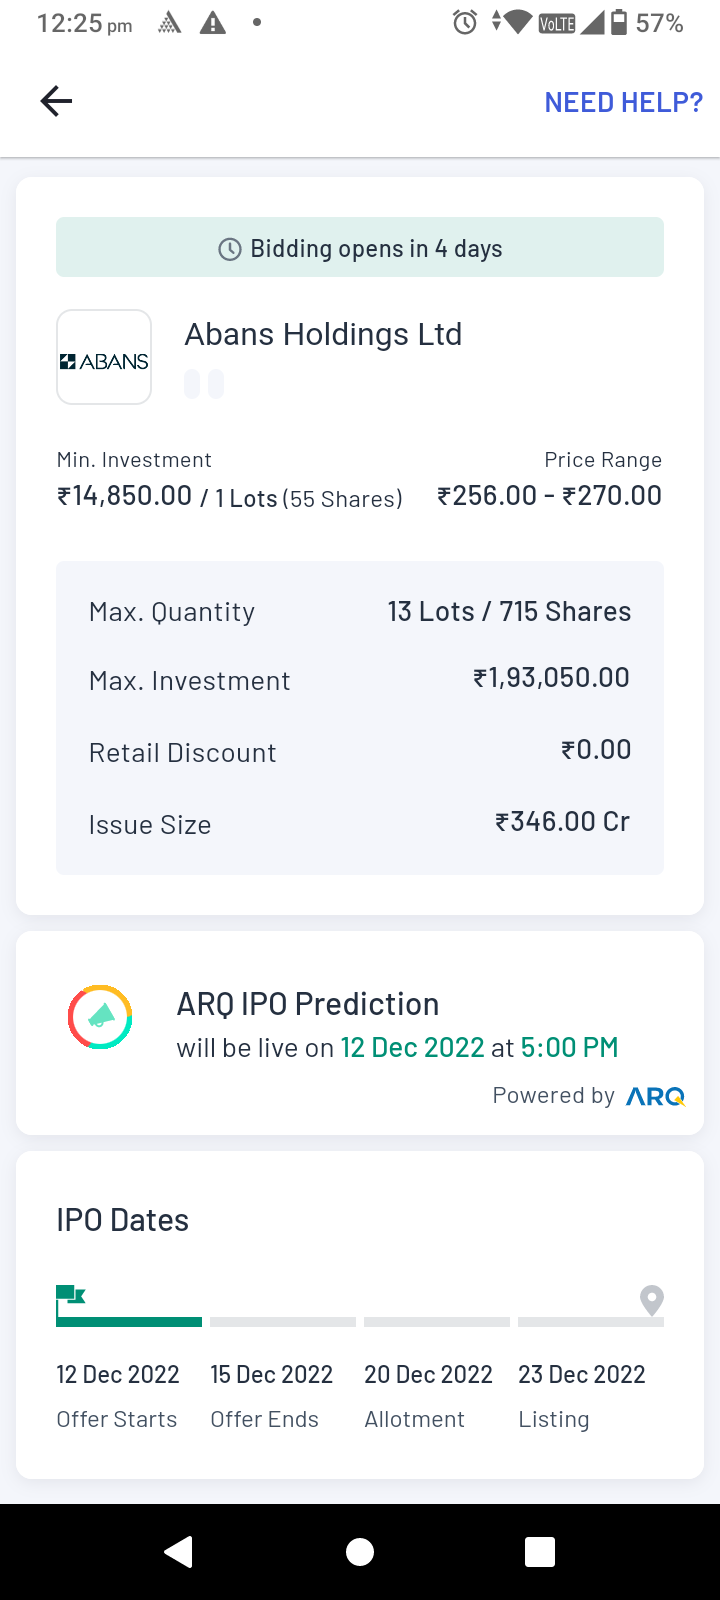
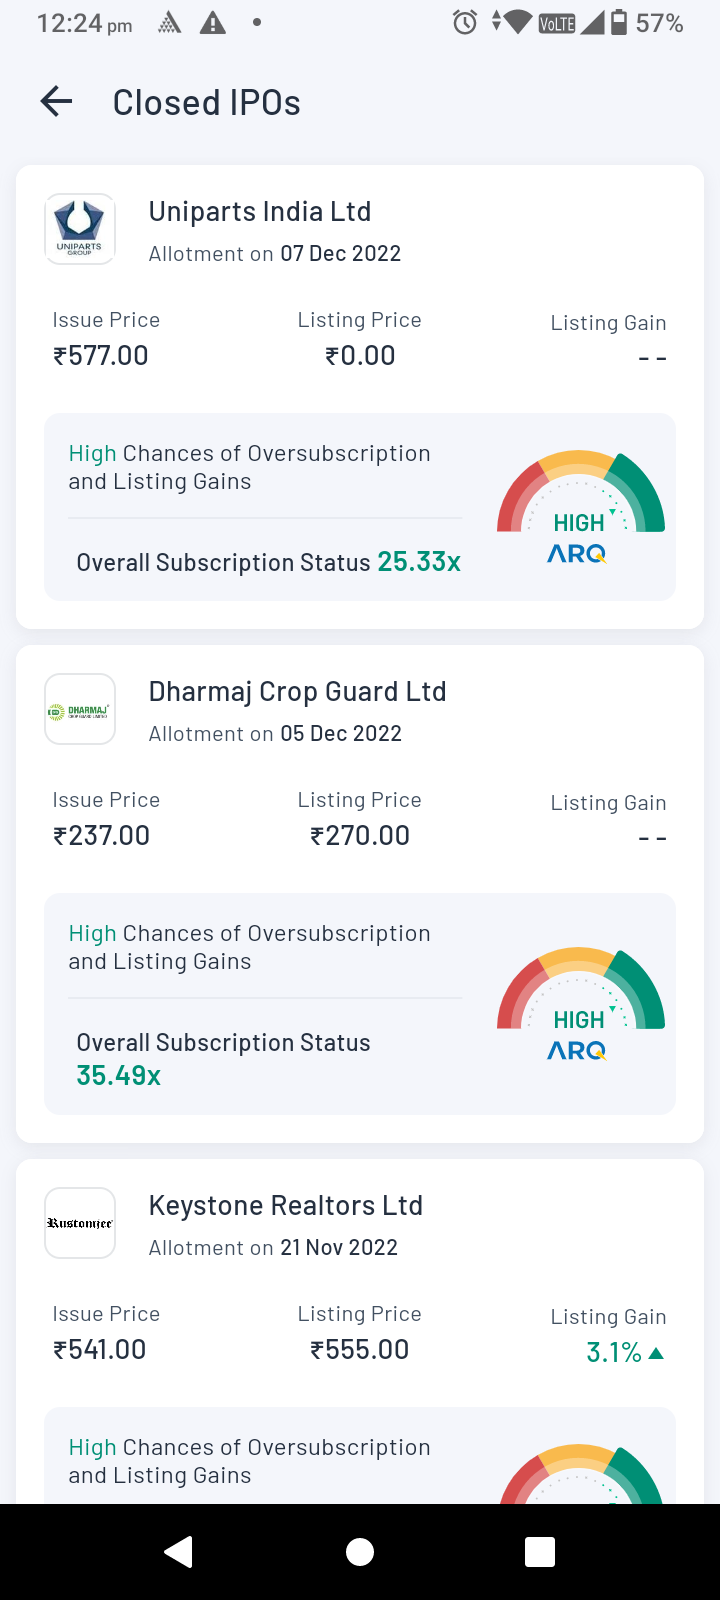
Figure: Open & Upcoming IPOs (left), individual IPO details (middle), Closed IPOs (right)
Important IPO dates:
Bidding Window - This signifies the dates when the offer starts and when the offer ends - during this period the users are free to cancel or modify their IPO orders.
In order to submit a successful application, you need to accept the mandate before 5:00 pm of the offer end date from your payment service provider’s application e.g. GPay, PhonePe, etc.
In case you are unable to find your payment mandate, log in to your payment service provider’s app > Go to the Mandate section > Check for pending mandates.
Allotment Date - This is the date when you get to know whether you have been allotted the shares you applied for or not. The allotment is done on a completely random basis by the Registrar - but Angel One will also communicate to you about the allotment (through SMS, email and in-app notification).
At this point, if you have received the allotment, the shares will be credited to your demat account one day prior to the listing of the issue in the secondary market. For the users who did not receive their allotment, their funds will be unblocked within 3-4 days of the allotment directly from your bank.
Therefore, if you have any queries regarding the unblocking of funds, you should contact your bank directly.
Listing date - On this date, the IPO is listed on the secondary market at 10:00 am. Thereafter, you can log in to your Angel One account and check out your position from the app’s portfolio section.
IPO orders
Scrolling right takes you to the list of IPO orders made by you. Here you can see a list of the IPO orders that you have invested in so far.
Under this section, you can see the following details related to the aforementioned IPO orders -
- Name of the company
- Investment amount and the number of lots invested in
- Listing Date
- Status of the IPO order and the further actions required in order to execute the order (as well as deadlines for such actions).
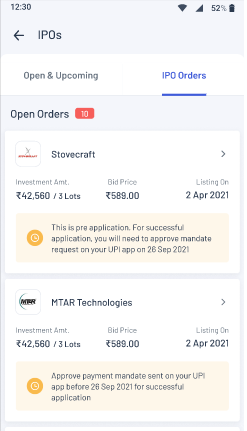
Clicking on any of these IPO orders will lead you to a page where further details of the IPO orders are given such as -
- Investment amount
- Lots
- Bid price
- Application date
- Deadline for approval of payment
- Date of allotment
- Further application details
Note: At this point you can choose to modify the IPO order by clicking on the “Modify Order” Button. We allow the users to cancel or modify their IPO orders not only before the placing of the order but even after your funds have been blocked (in lieu of the particular IPO order). However, the user cannot cancel/modify the IPO order once the bidding window for that IPO is closed.
In the event that you cancel your IPO application or your application gets rejected due to other reasons like mandate expired, invalid UPI ID or other technical reasons, you will still have the option to “Apply Again“ on the Order page.
IPO Best Practices
If you go to the Home page of the Angel One app and click on IPO, on the top you will find two cards that say -
- Learn everything about IPO and how to invest - Here you will find a comprehensive video on -
- Basics of IPOs
- Factors influencing their allotments and application rejections
- A 3-step process required to invest in IPOs
- Know the best practices to maximise IPO allocations - Clicking this will give you the list of 7 important steps that you should take in order to successfully apply for an IPO. Scrolling down, you will find the option to ‘Know More’, which will take you to a detailed article on IPO best practices.
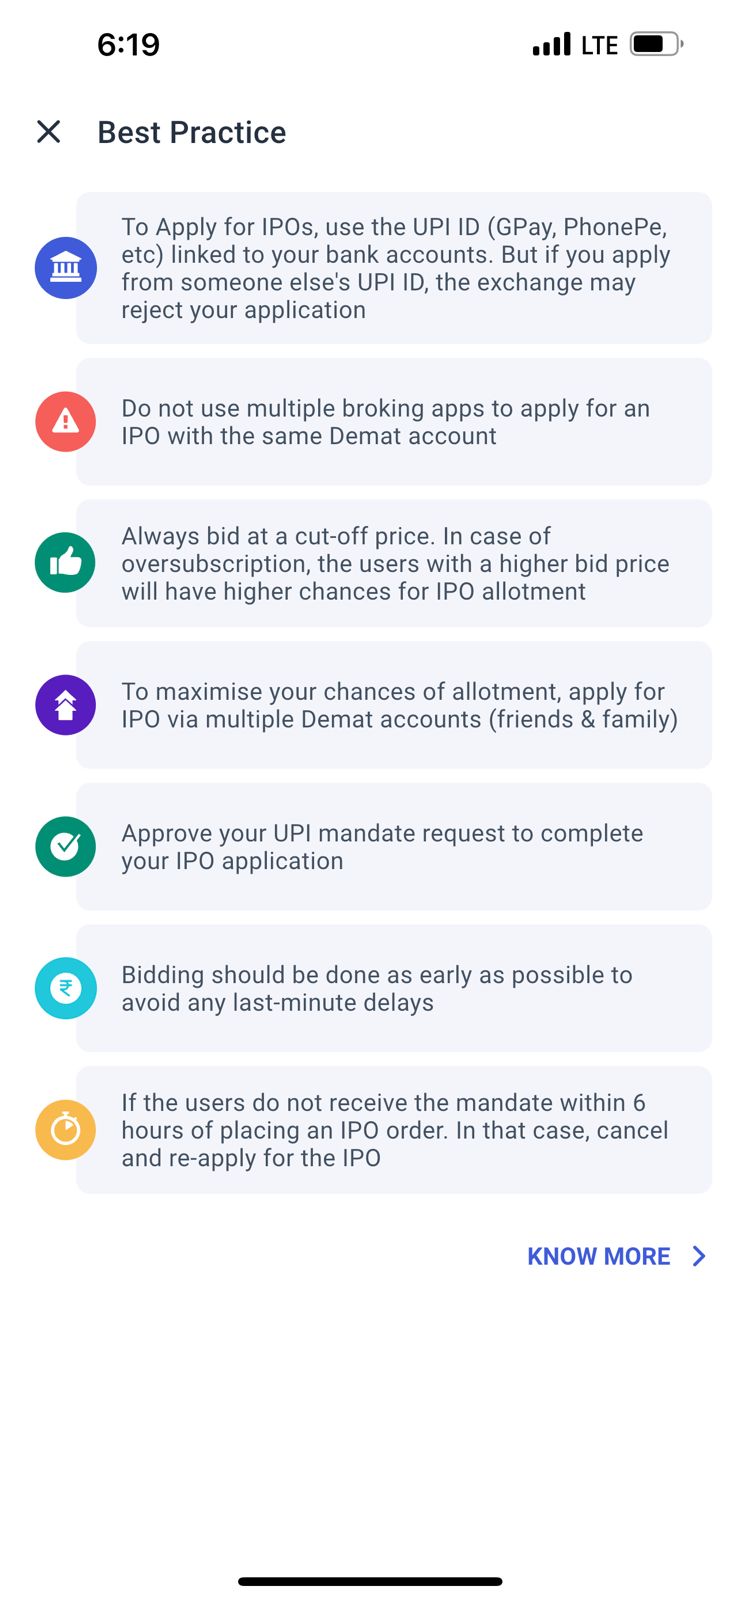
Figure: IPO best practices
The suggestions are designed to help a new investor easily navigate the tricks to find success in IPO investments.
Track IPO Order Status
Once you place an IPO order, you can easily track the order status by reaching the detailed IPO order page from the ‘IPO Orders’ list.
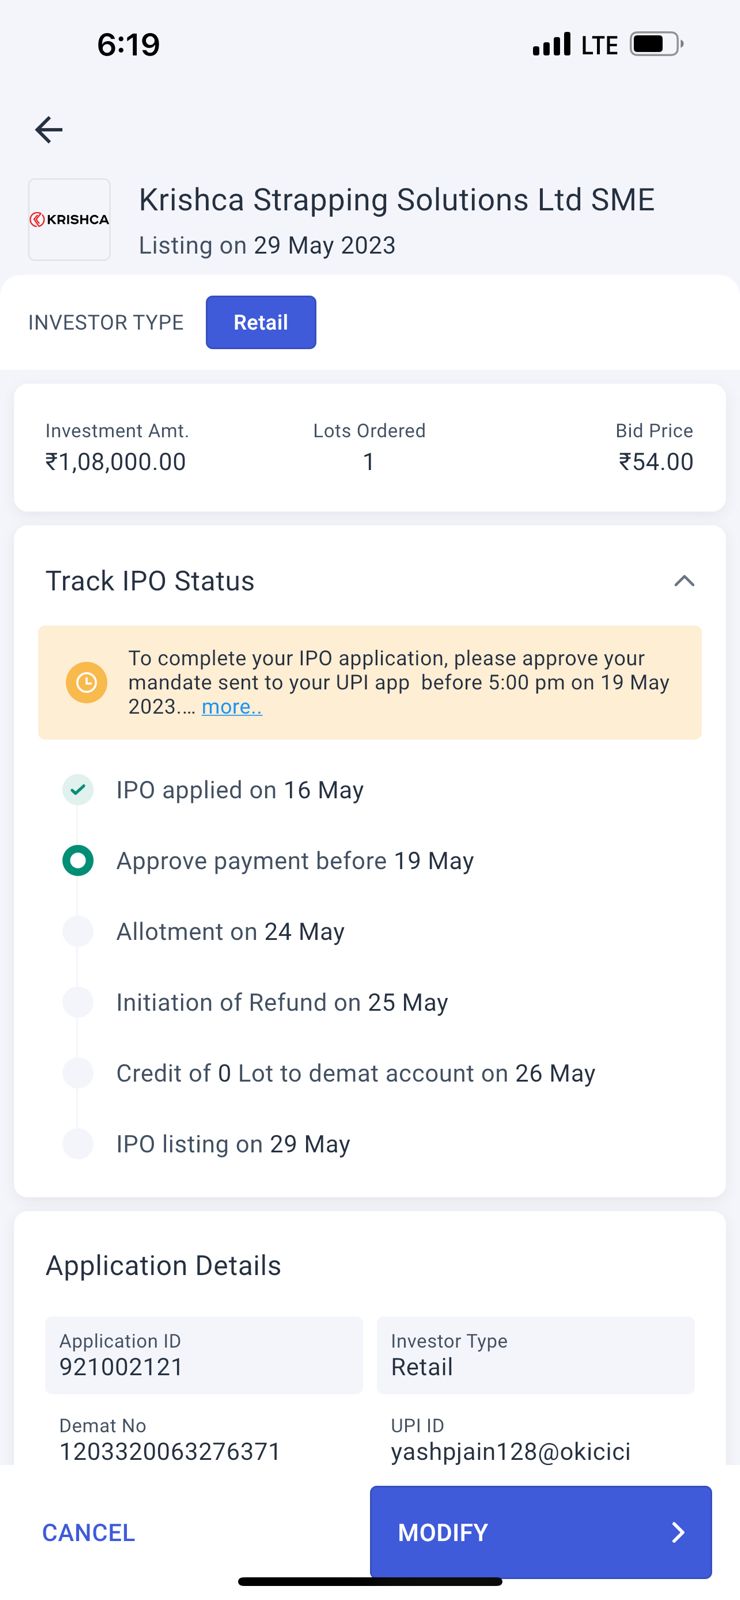
Figure: Tracking IPO order status
If you want to know more about IPOs and how to apply in them, click on the “Need help?” section. You will find both written and video content. For further knowledge, you may start reading articles and watching videos from the Angel One app’s learning centre.
Mutual Funds
The mutual funds section allows users to easily navigate through the various mutual funds on offer in the market and compare them. The mutual fund portal consists of 3 main sections - home, investments and orders.
Home
First you will find the “Discover Mutual Funds” section that allows you to find mutual funds based on your preferred category such as -
- Top rated
- High returns
- Tax saving
- SIP with 500
- Low risk
- SIP with 100
Click on any of the above or on “Explore all funds” to see the entire list under each category. The list contains the name of the fund, the rating (e.g. 5 star), the category of fund in terms of asset (e.g. ‘equity’), strategy (e.g. ‘index fund’) and the returns of the fund. The time frame of the funds returns may be adjusted by clicking the arrows beside the time frame mentioned on the top right corner of the list.
If you want to ignore the suggested funds and want to search funds on your own, you can use the search bar that is available on the top right of the page. The search bar will also give you the exact same details for the funds.
Once you choose a fund in order to know further details about it, you can click on the fund - this will take you to a page that has 4 sections that are the following:
- Overview
- Scheme details
- Fund holdings
- Peer comparison
Overview
This section shows basic details about the fund such as -
- Percentage returns over different time frames through a chart - you can change the time frame by clicking the time frame options just below the chart. You can also check the daily returns of the fund on any given day within the chosen time frame by simply clicking (and gently scrolling if needed) on the chart. Below the chart, the returns are also compared to the returns from the index of assets in the similar category (e.g. Nifty midcap 150 returns compared to a midcap fund).
- Net Asset Value (NAV)
- ARQ ratings
- Category of fund (e.g. midcap fund)
- Number of Angel One users who have invested in this fund.
- Month and year when he fund was started
- Minimum investment needed for SIP and one-time investment
- Lock-in period
- Returns from past performance of the fund - this measures how much returns would have been given by an investment (SIP or one time) over a given duration. You can simply click on the mode of investment (SIP or one-time) and then adjust the amount and duration of investment by clicking (or moving finger) on the bars adjacent to them. The exercise will give you -
- What amount of investment would have been required in total
- How much money would have been gained
- The percentage return gained
- The amount received on maturity
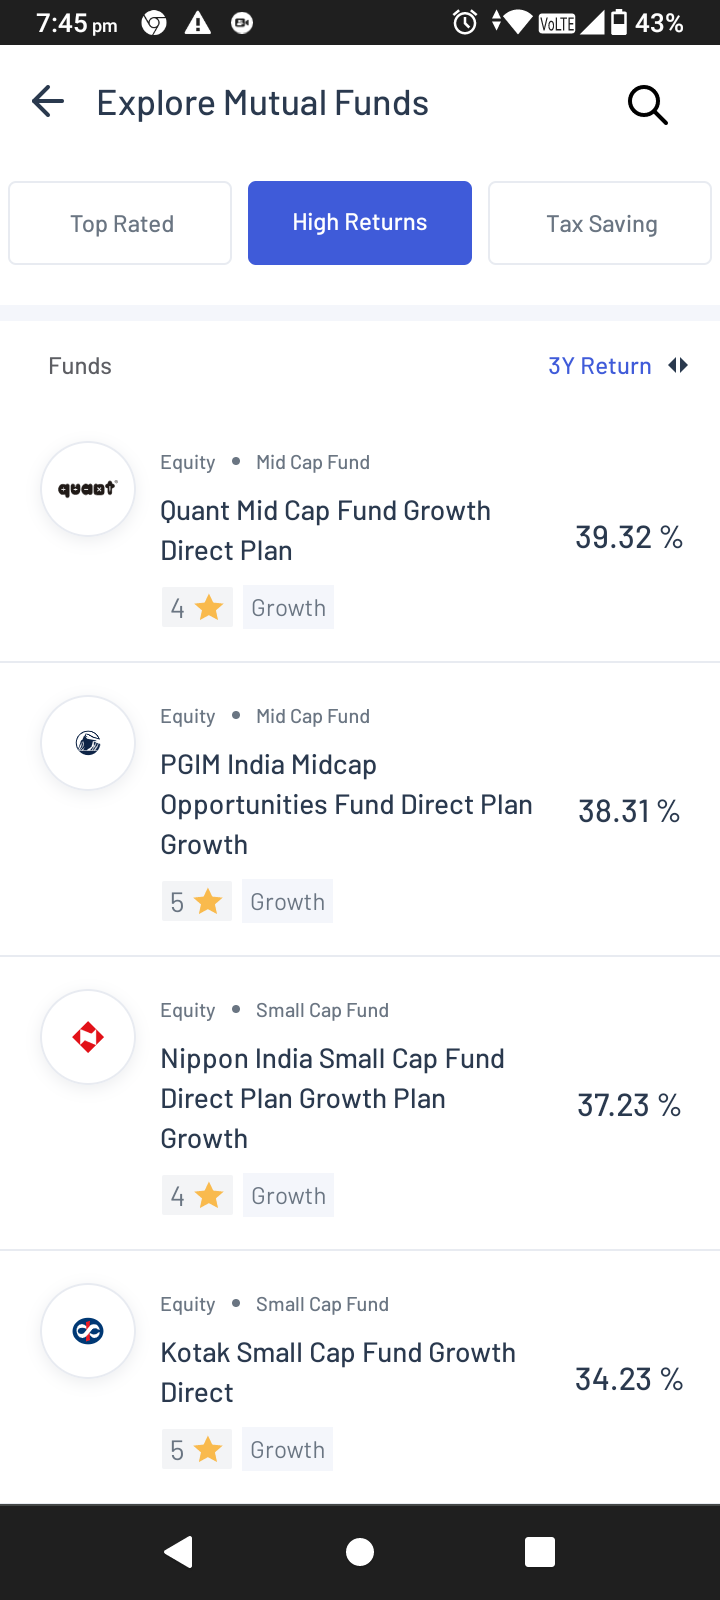
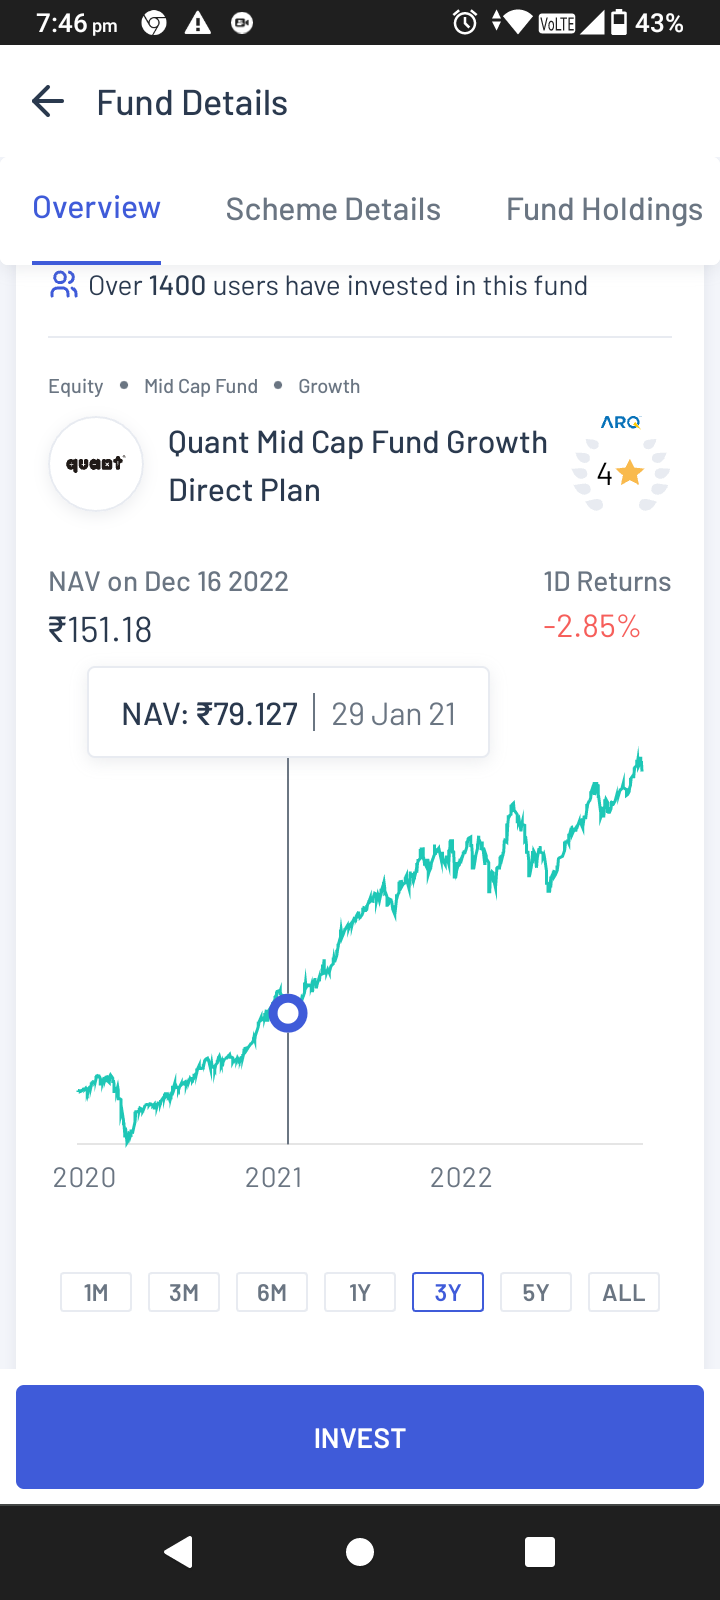
Figure: List of funds (left) and Overview (right)
Scheme Details
Scrolling to this section would give you the following pieces of information -
- Asset Under Management
- Expense Ratio
- Exit Load
- Tax Implications e.g.: taxes on gains upon withdrawal before or after 1 year.
- Assessments of risk and ratings by both ARQ and other agencies such as Crisil, Morning Star or Value Research.
- Name of the fund manager(s).
If you cannot recall the meaning of these terms, then you can easily click on the “i” icon beside the heading saying “Basic Information” and you will get the explanations for those terms as well as NAV.
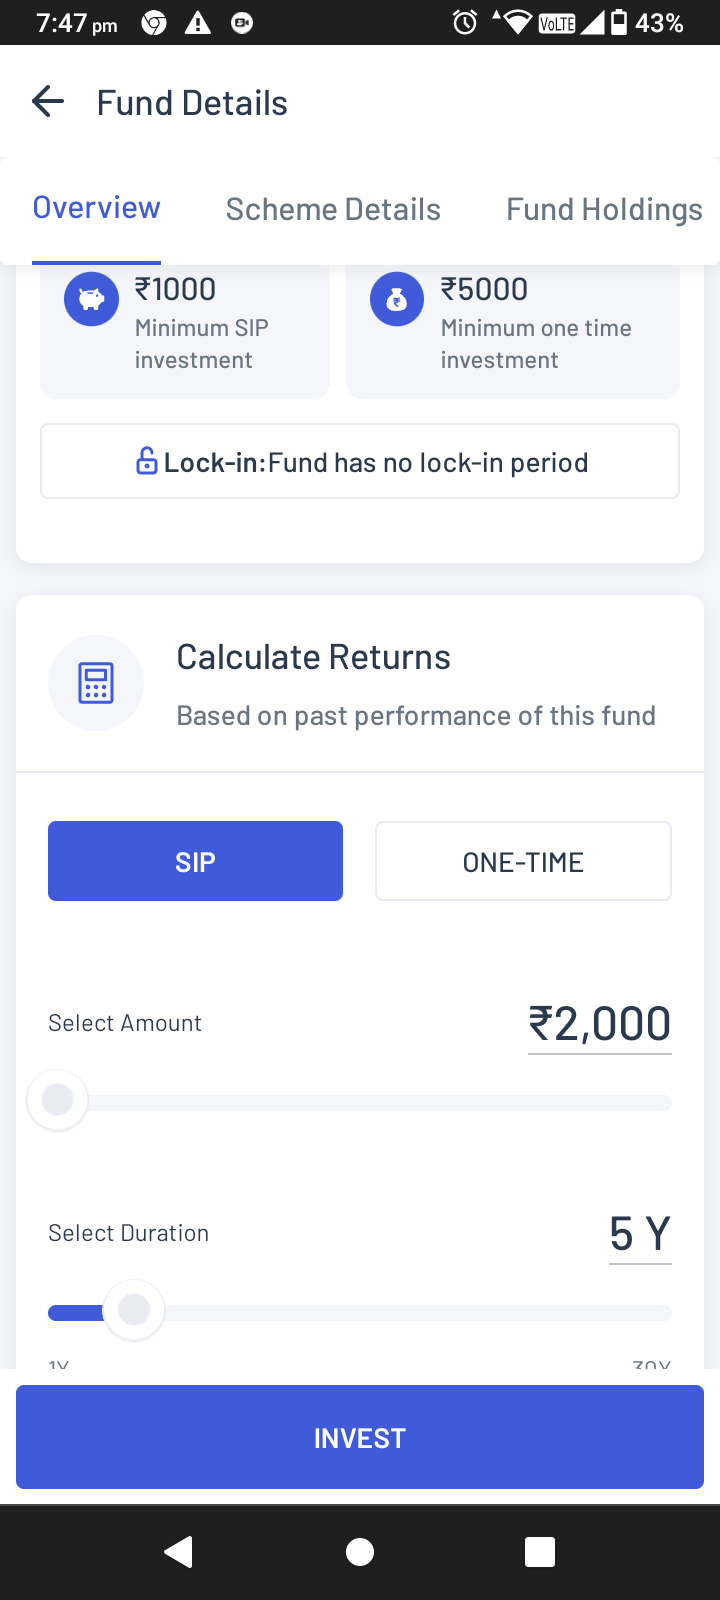
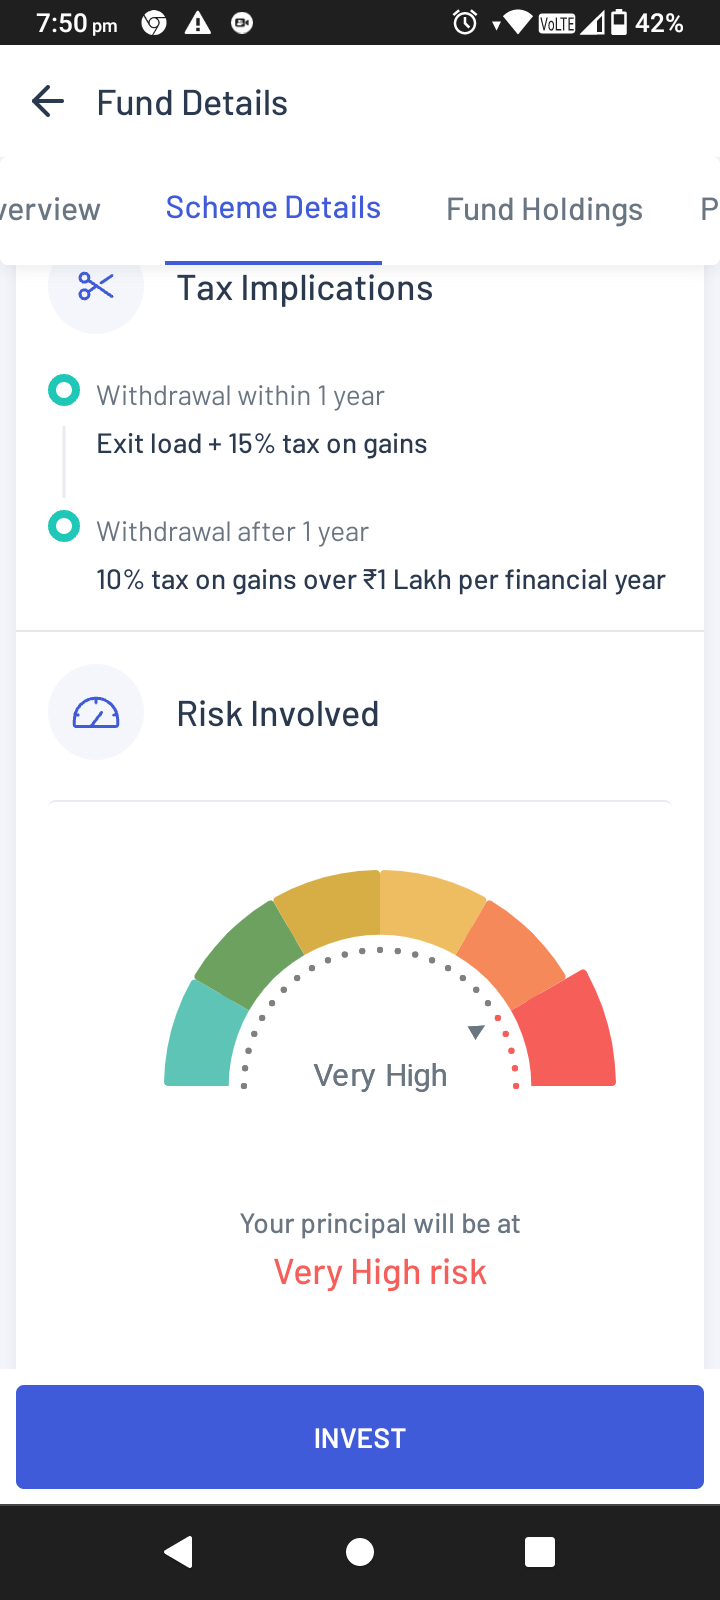
Figure: Calculation of returns (left) and Scheme details (right)
Fund Holdings
This section shows what proportion of the fund has been invested in which company. You can view the entire list by clicking on “Show All”.
Tracking External Funds
You can track all the different funds where you have invested in one place based on your PAN. This means you can track a fund, even if you have applied it through a platform other than the Angel One app.
To consolidate all your mutual fund investments in one place, just take the following steps for an OTP verifications:
- Open your Angel One app and go to the ‘Mutual Funds’ section from the Home page.
- Reach the ‘Investment Dashboard’ from -
- The Investment page by clicking ‘All’.
- The Dashboard page by clicking ‘External Funds’, which will land you on the same page as above (i.e. in 2.a.).
- Click on ‘Track External Investments’.
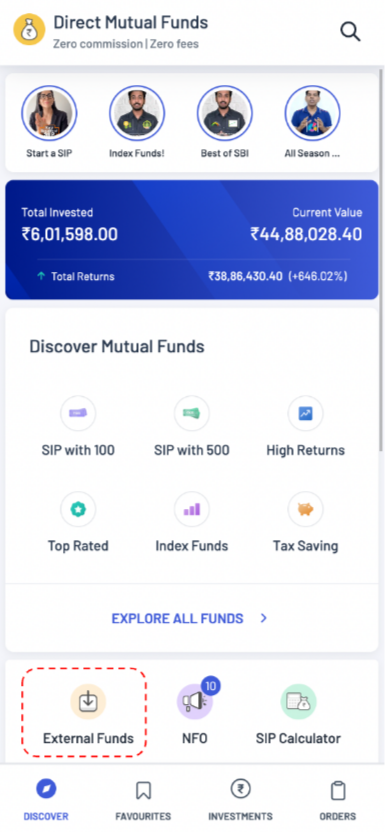
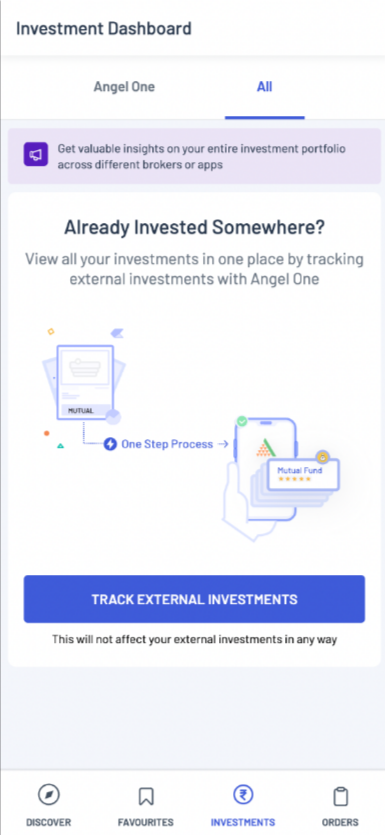
Figure: Click ‘External Funds’ on the ‘Discover’ page (left) and then click on ‘Track External Investments’ (right).
- Click on ‘Generate OTP’ from the sleeve below.
- Click on ‘Verify’ to confirm the OTP.
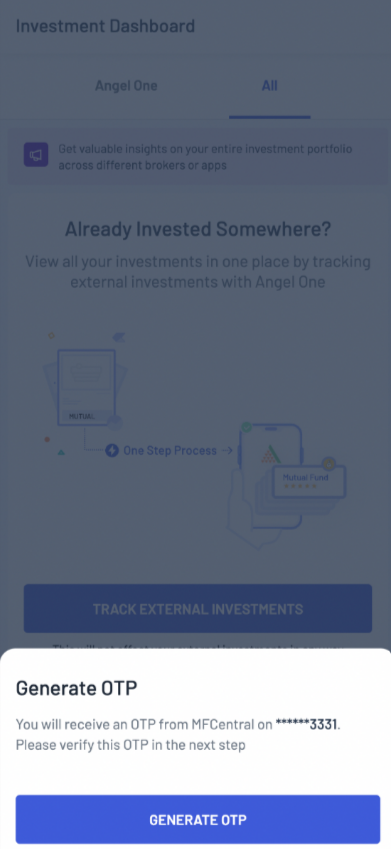
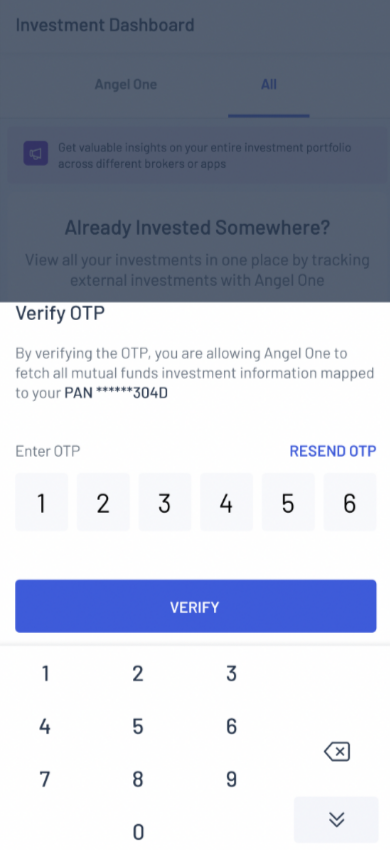
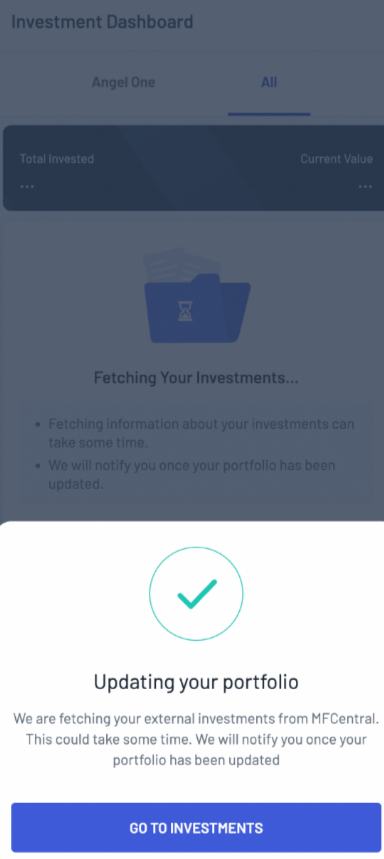
Figure: Generating OTP (left), Verifying OTP (middle), and final page (right).
And you are done! Once the OTP is confirmed, it takes around 30 seconds to 5 mins depending on your investment history to consolidate the data on your app. Once the data is fetched (based on your registered PAN number with Angel One) and processed, you will be notified on your app and email that your portfolio has been updated.
Peer Comparison
Here you can see a list of similar funds with their ratings and returns. Like before, you can adjust the time frame by clicking on the arrows on the top right corner of the section.
You can compare the fund’s performance not only to funds of other companies but also to other funds managed by the same company as well.
How to Invest?
• Once you choose a fund, you can invest in the fund directly by clicking on the “Invest” button below.
• You can choose to invest via either an SIP or a one time investment.
• Enter the amount that you want to invest under “Enter Instalment Amount”.
• You will see the transaction charges right below. Further down you will see when your next SIP payment will take place.
• Click on the “Proceed” button at the bottom to begin the SIP investment.
The process for a one time investment is similar as you just have to enter an investment amount and the transaction charges will be shown below. However, there will be no provision of future payments.
Coming back to the Mutual Funds home page, you can scroll down to find mutual funds that are currently “Popular with other investors” - you find new funds easily by scrolling to the right and know further details by clicking on the fund.
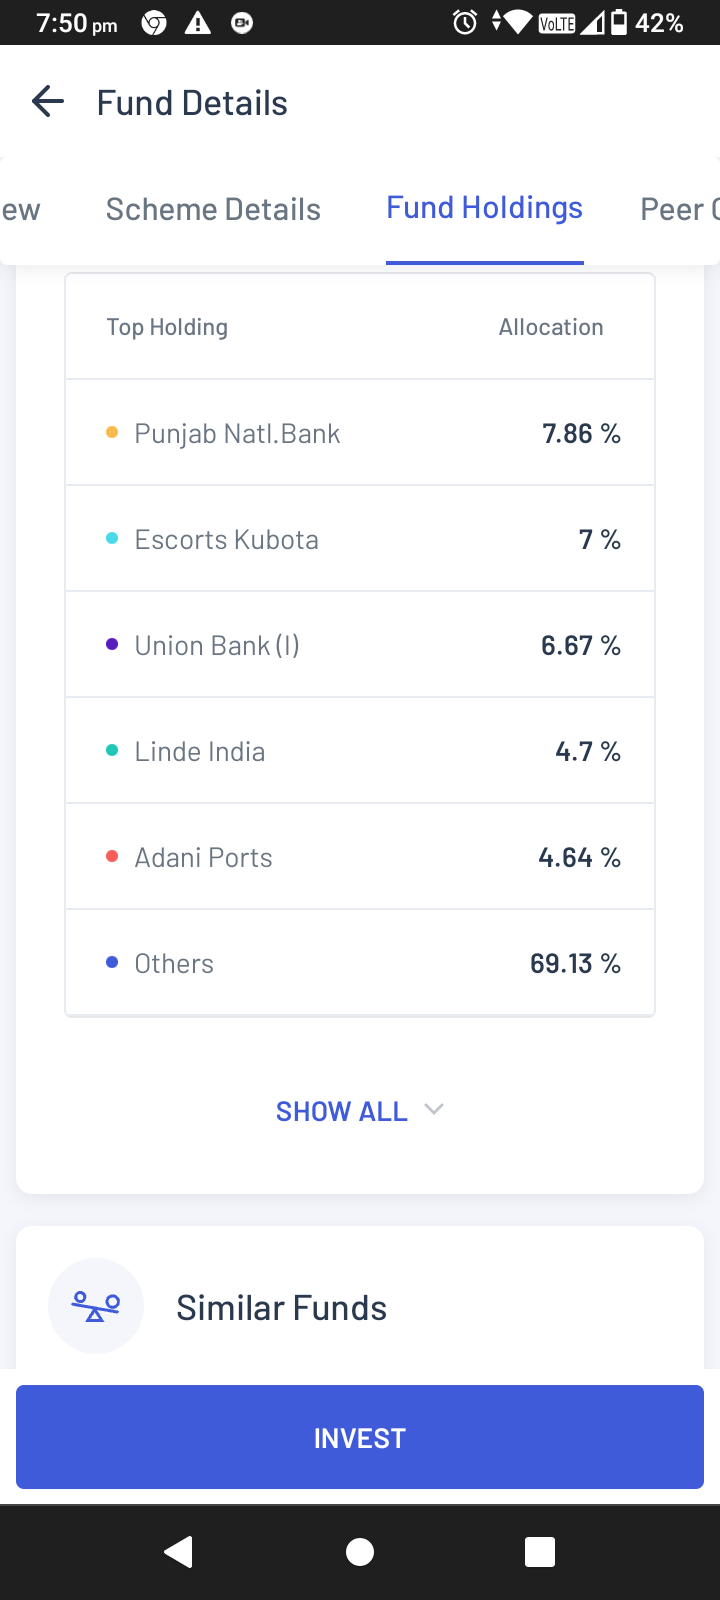
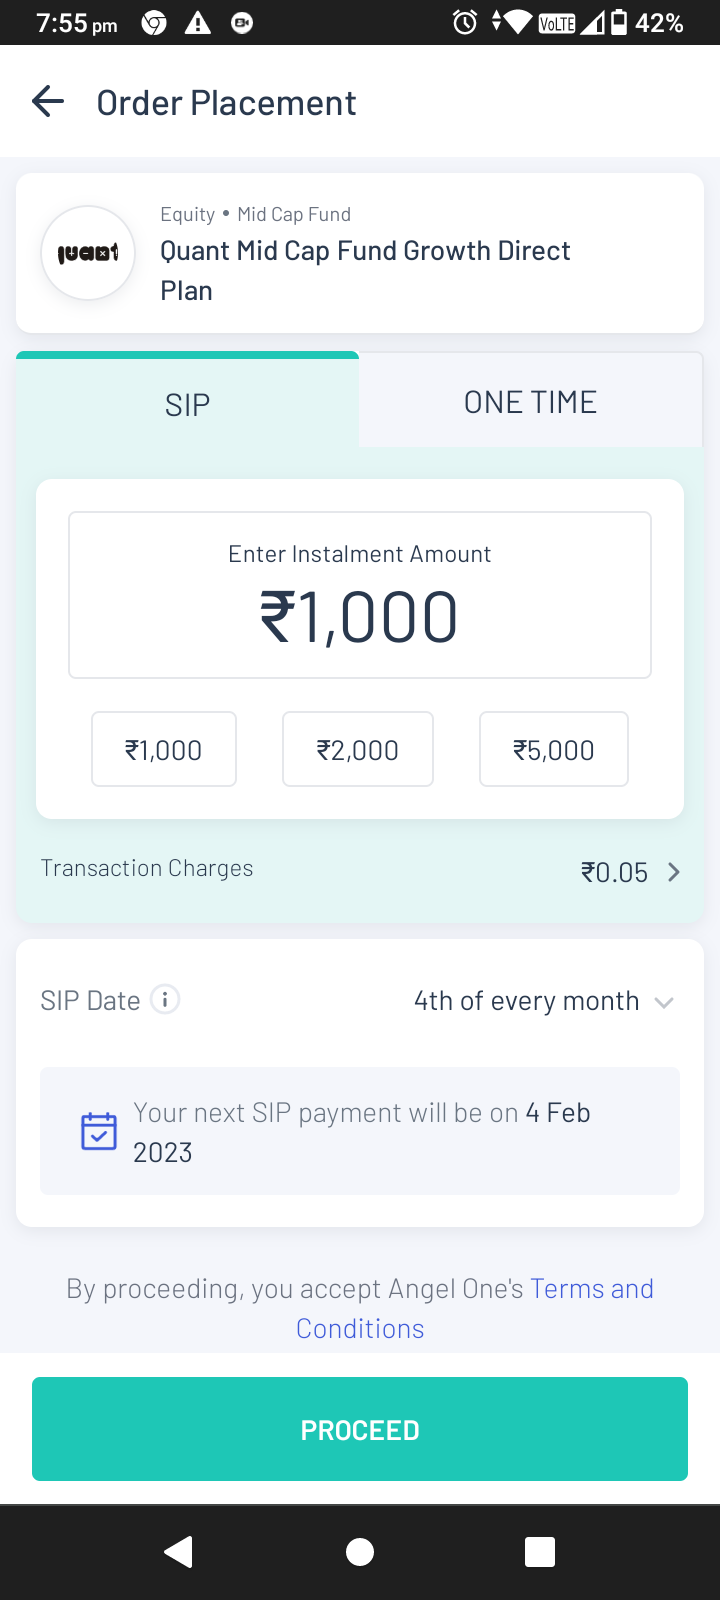
Figure: Fund Holdings (left) and mutual funds order placement page (right)
Investments
The first thing shown here is the amount of investment made by you so far and the total value of those investments so far. You can also explore funds from this page by viewing the popular funds and by clicking on “Explore funds”.
Sharing Mutual Fund Details
You can share the details of your mutual fund investments by the following method:
- Go to the ‘Investments’ and click on a particular fund. Click on the fund once more and you will be taken to the ‘Fund Details’ page.
- On the top right corner, you will see a share icon.
- Upon clicking the share icon, you can choose a social media platform to share the fund information.
- The text will be pre-filled, which you can then share on your preferred site.
You can also share fund details directly from the order summary page which is presented to you right after you place an order. Once you click the share icon, the remaining process is the same as before.
Gold bonds
SGBs (or Sovereign Gold Bonds) are government securities denominated in grams of gold i.e. 1 unit of SGB = 1 gm of gold. They can be bought online on the Angel One platform in both Primary and Secondary Markets.
• Primary market issues are controlled by RBI and every issue is open for 5 days for users to buy.
• Secondary markets are available like stock scrips which you can search and buy on the app.
Opening the SGB section shows the following categories related to the Gold bonds -
- Open issues - All new SGBs which you can invest in right away are listed here with details such as closing date (of the offer), Price/gm and key benefits.
- Upcoming issues - This section shows which bonds are coming up, but are not open issue, i.e. not open for trading yet
- Past Issues - It shows a list of past SGBs issued along with their subscription date and price per gram.
- Order Book - This section allows you to view the list of all SGBs that you ever ordered (though you can adjust the time period for which you are viewing) along with their quantity, issuance date and status (i.e. ordered or rejected).
- Portfolio - This section gives you a list of the bonds you currently hold, their quantity, their LTP (last traded price), change in LTP, their current market value and the investment value (Inv. Value).
You can choose the category by simply clicking on the icon showing the category on the top left corner.
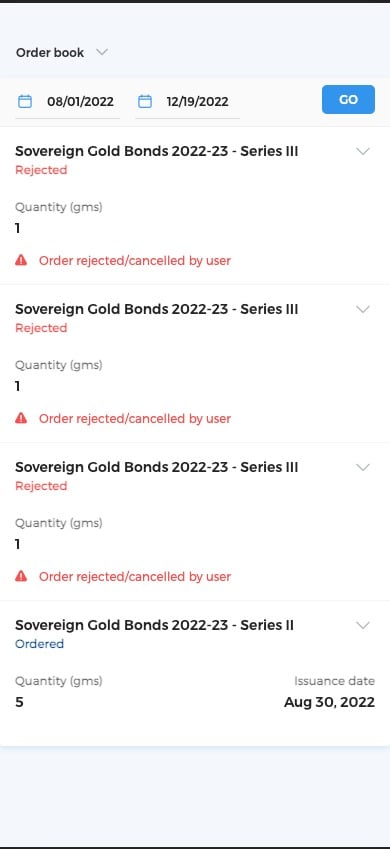
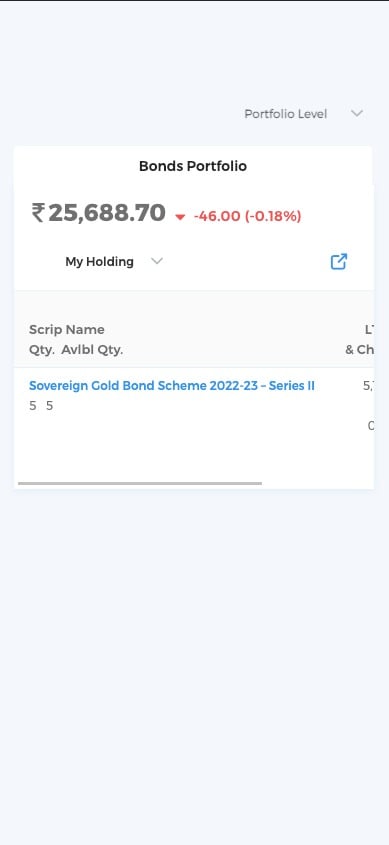
Figure: Orderbook (left) and SGB Portfolio (right)
How to invest
In order to buy SGBs in the primary market, all you have to do is click on the open issue. Once you choose a SGB to invest in, click on the “Invest” button. Thereafter, the app will show you if you have adequate funds to invest or not based on the -
- Quantity you are ordering
- The payable amount
- The available limit (i.e. the amount of money that can be used by your account)
Once you have an adequate amount, you can invest.
In order to buy SGBs in the secondary market, all you have to do is go to the watchlist and search for ‘SGB’. If there is a specific SGB you are searching for, you have to type in the month and year when the SGB matures as well. For example, “SGBJUL25” would be a perfect search item as it would show the SGB that will mature in July 2025.
Right below this name, you will also find additional information written as Sgb2.50%jul2025sr-ii17-18. This means it gives a 2.5% interest rate and was issued as a series ii bond (‘sr’ denoting series) in the financial year 2017-18.
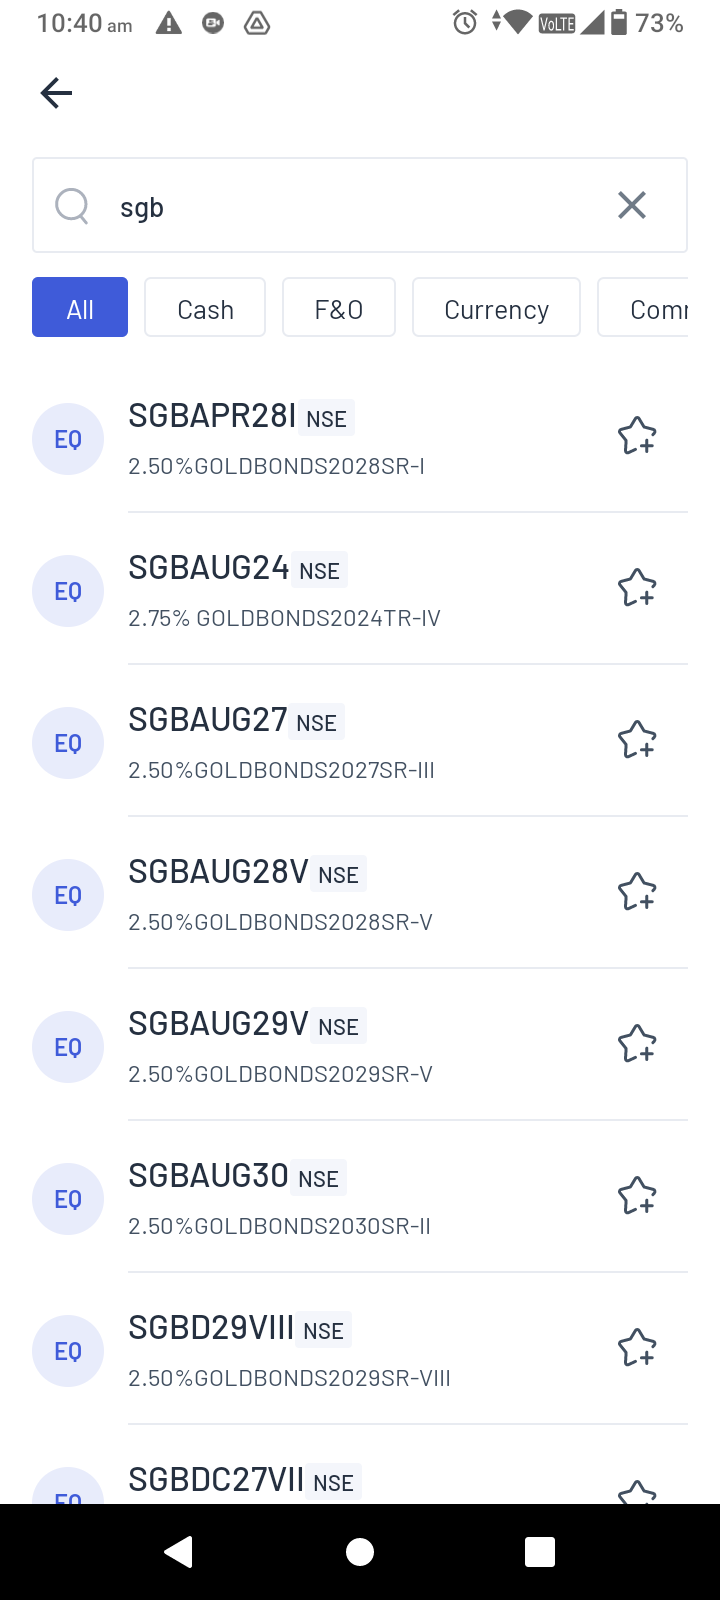
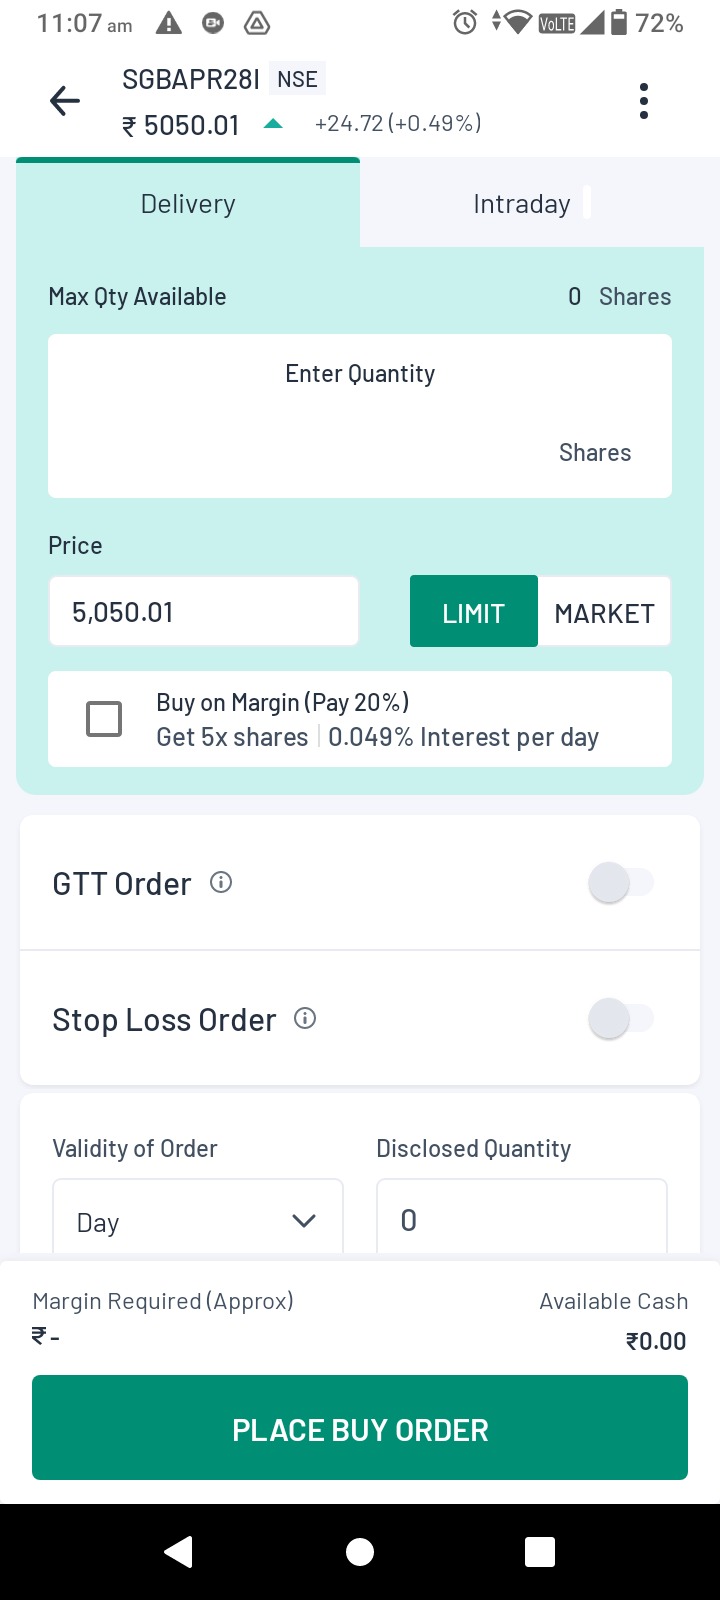
Figure: SGBs in the secondary market - search on watchlist (left) and order through normal orderpad (right)
Add Funds to Trading Balance
This section is applicable only to non-invested users.
Explanation - In the Angel One app, we have the following three kinds of users:
- Guest user - One who has downloaded the app but has not completed setting up their account.
- Non-invested user - One who has set up their Angel one account but has not made any trades so far.
- Invested user - One who has made their first trade with the Angel One account
As mentioned above, only the second category of user will be able to view the ‘Add Funds’ section on their Home page.
If you are a non-invested user, clicking on any of the standard funds additional amounts (e.g. ₹2000 or ₹5000) or ‘custom’ will take you directly to the “Add Funds” section under Account. You can learn more about adding funds to your account in the Account section of the handbook.
Insta Trade F&O
Clicking on the Insta Trade F&O icon will allow you to directly reach the chart of Nifty and BankNifty along with all the relevant indicators as well as a section showing unrealised P&L on the top right corner.
Below you will also find the buttons to access your open orders and option chain of the asset directly. You can directly access the options to ‘Buy Call’ and ‘Buy Put’ from this section.
Clicking on either will show you suggested options contracts for that asset (along with their expiry, required margin, price changes and tags showing special features about the contracts e.g. Near OTM, ITM, Most Traded etc.) - you can expand the list by clicking ‘View Option Chain’ on the top right corner.
After choosing a contract, click on continue below to proceed with the contract.
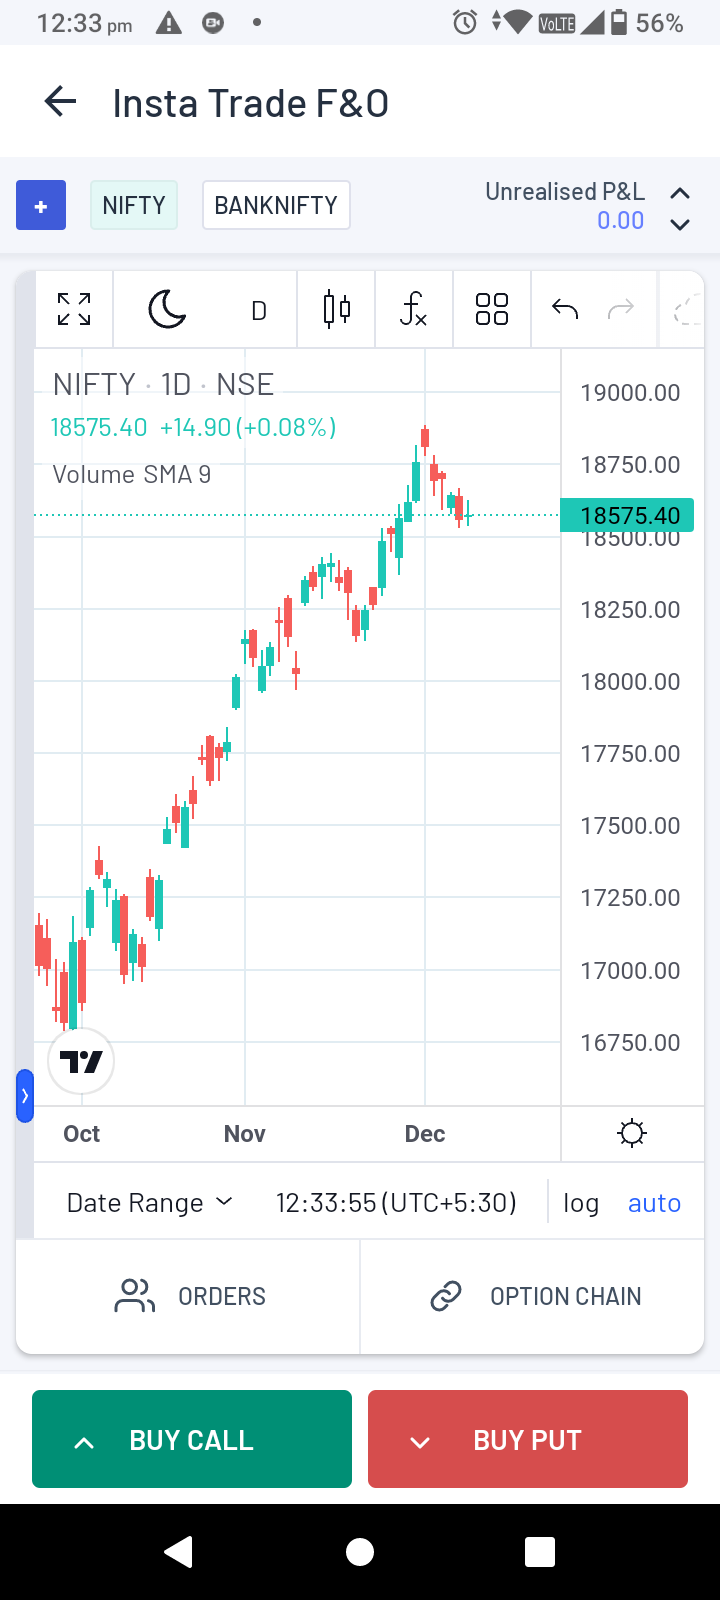
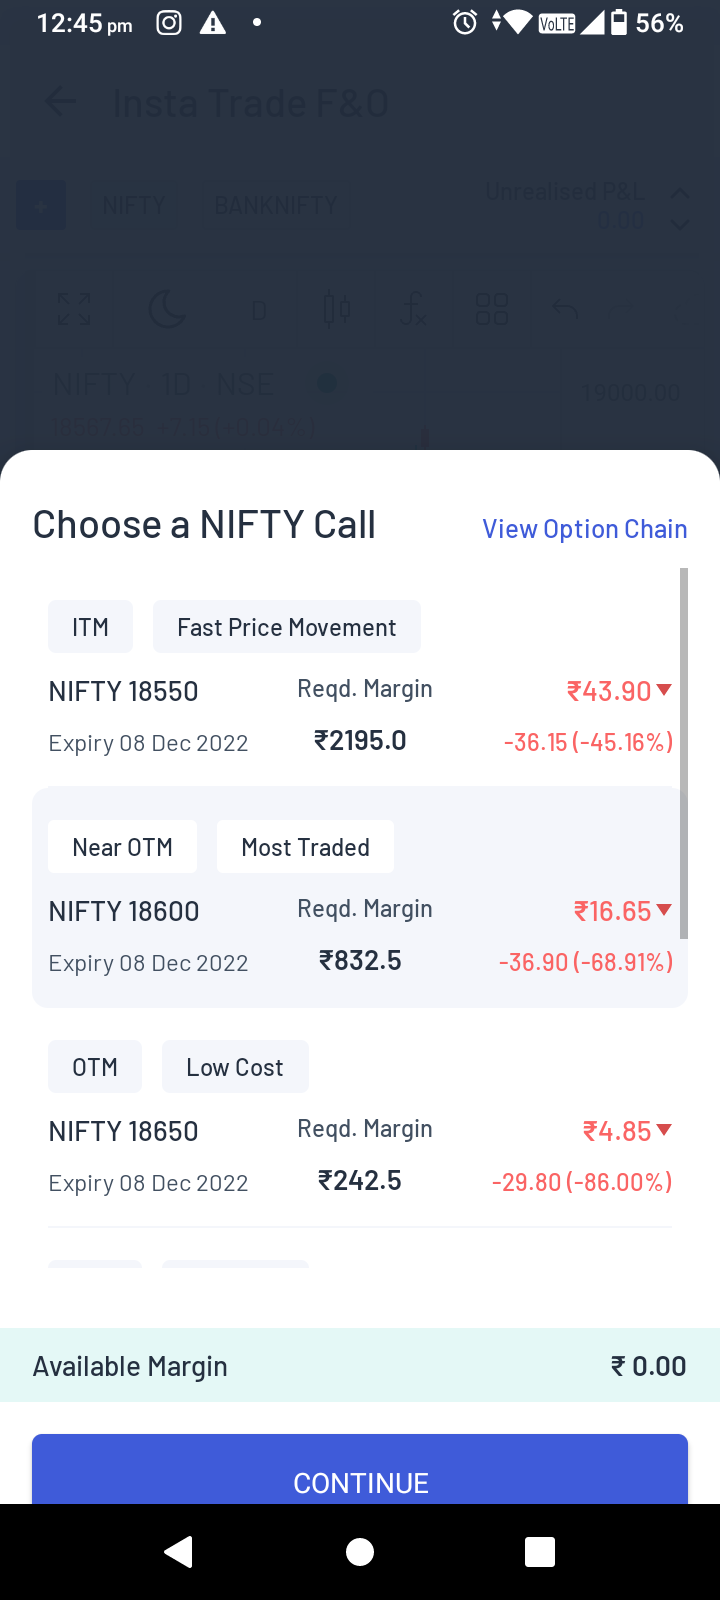
Figure: Insta Trade F&O page (left) and the list of calls page (right) that you reach when you press “Buy Call”
Refer Your Friends and Earn
You can access this scheme by clicking on the Refer and Earn tab. You can read more about the scheme by checking the Account section of the handbook.
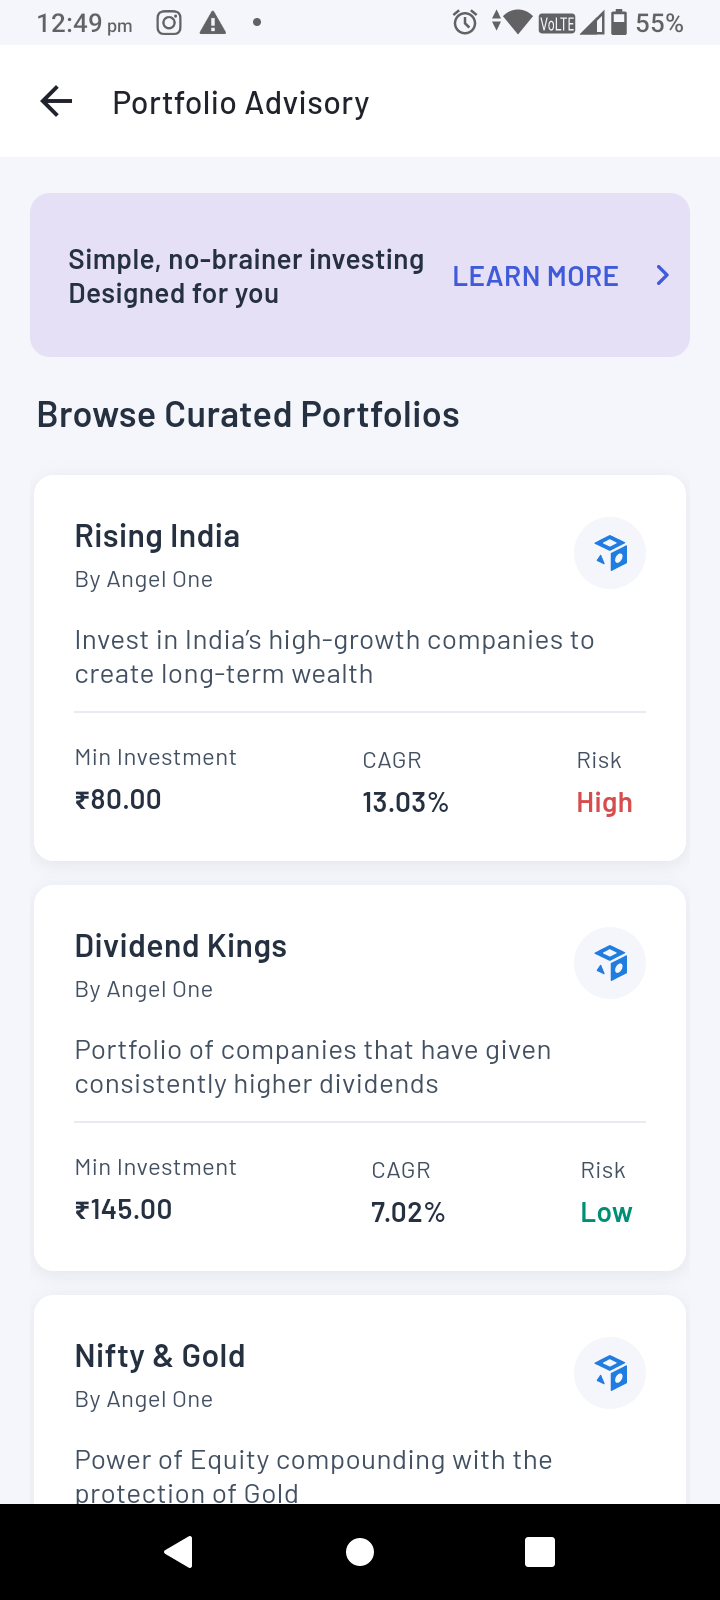
Portfolio Advisory
It is a marketplace of multiple pre-defined portfolios that you can directly use or simply take inspiration from in order to build your portfolio. It allows you to buy and modify an entire portfolio and also gives you timely notifications on securities to buy/sell in order to rebalance your portfolio and maximise profits. You can also check the returns on your holdings overall.
There are no additional charges for this feature.
For each portfolio suggested in this section, the following details are mentioned:
- Minimum investment required
- Current compound annual growth rate
- Level of risk
For further details, click the icon on the top right of the asset (e.g. smallcase, ARQ Prime).
Top Stocks via Single Stock Advisory
This section gives recommendations on stocks to buy, including estimates of the amount of returns that can be earned.
If you click “View all calls”, you can find the accuracy rates (i.e. percentage of positive calls made) of the Angel one stock advisory for intraday, short-term, commodity, currency trading as well as long term investment.
Clicking on the arrow on the right on any of the above options will take you to the list of the calls (i.e. suggestions made) in that particular category alongside the number of positive and negative calls made by the app in that category as well.
The suggestions are categorised into 4 sections:
- Equity
- Futures
- Options
- All (i.e. all of the above)
For each security recommended, you will get the maximum profit and loss as per quantity invested . You can edit the quantity as per your preferred level of investment and check the same figures for that quantity. In order to get further assurance, you can click on “View details” to know further about the security tip under consideration. Further details in this subsection will include:
- Entry price (range) - This shows the rough price at which the initial trade should be made.
- Target price - This shows the price at which a GTT order can be placed in order to square off the position at a favourable price.
- SL price - This shows the price at which a stop-loss order can be placed
At this point, if convinced, you can directly buy the security under consideration by clicking the “Buy Now” button. If you are interested, but not convinced to buy the security just yet, you can also place the security under your watchlist by clicking the star plus icon.
Finally, below the long term investment link, you can see the performance of Angel one top picks as compared to the Nifty Mid cap in the past few years.
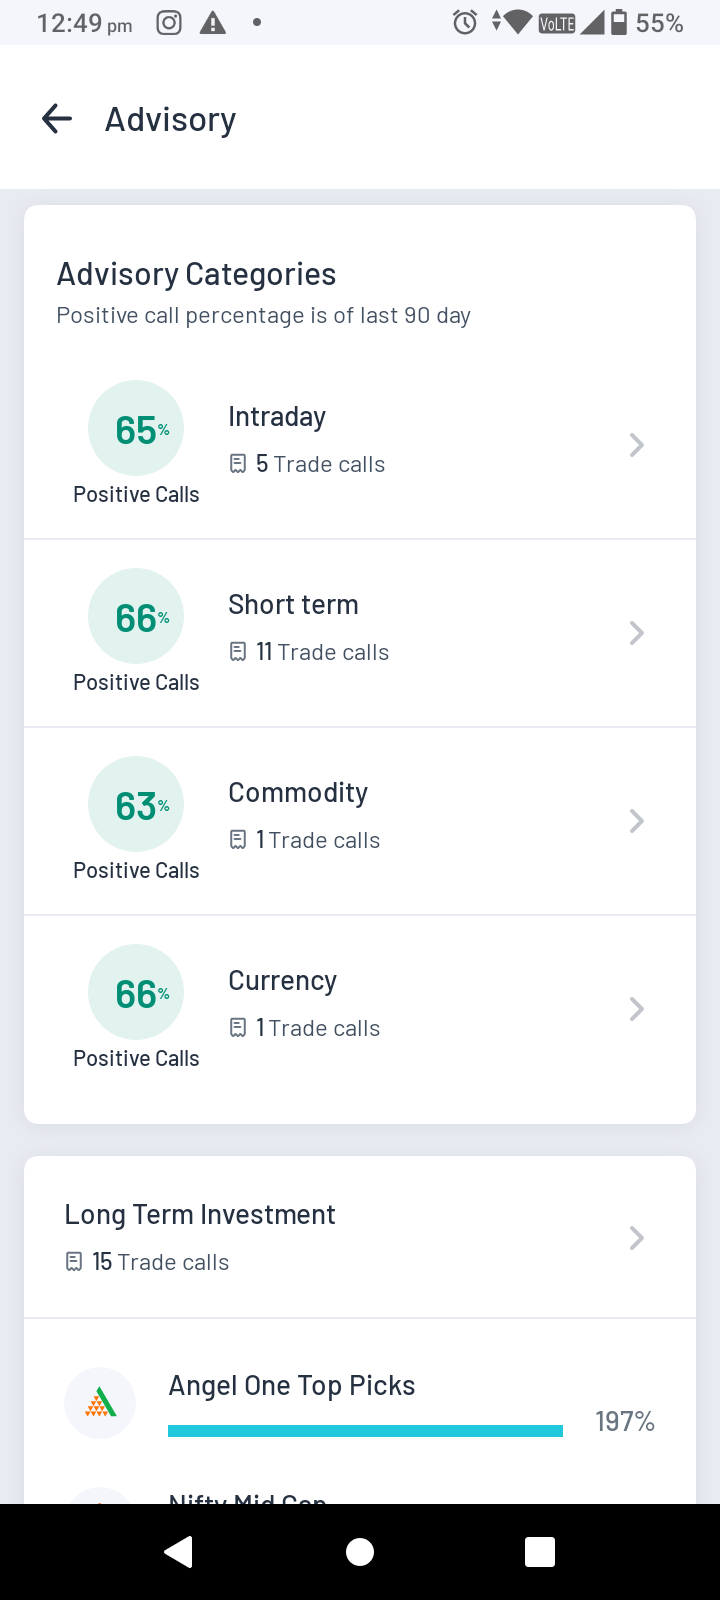
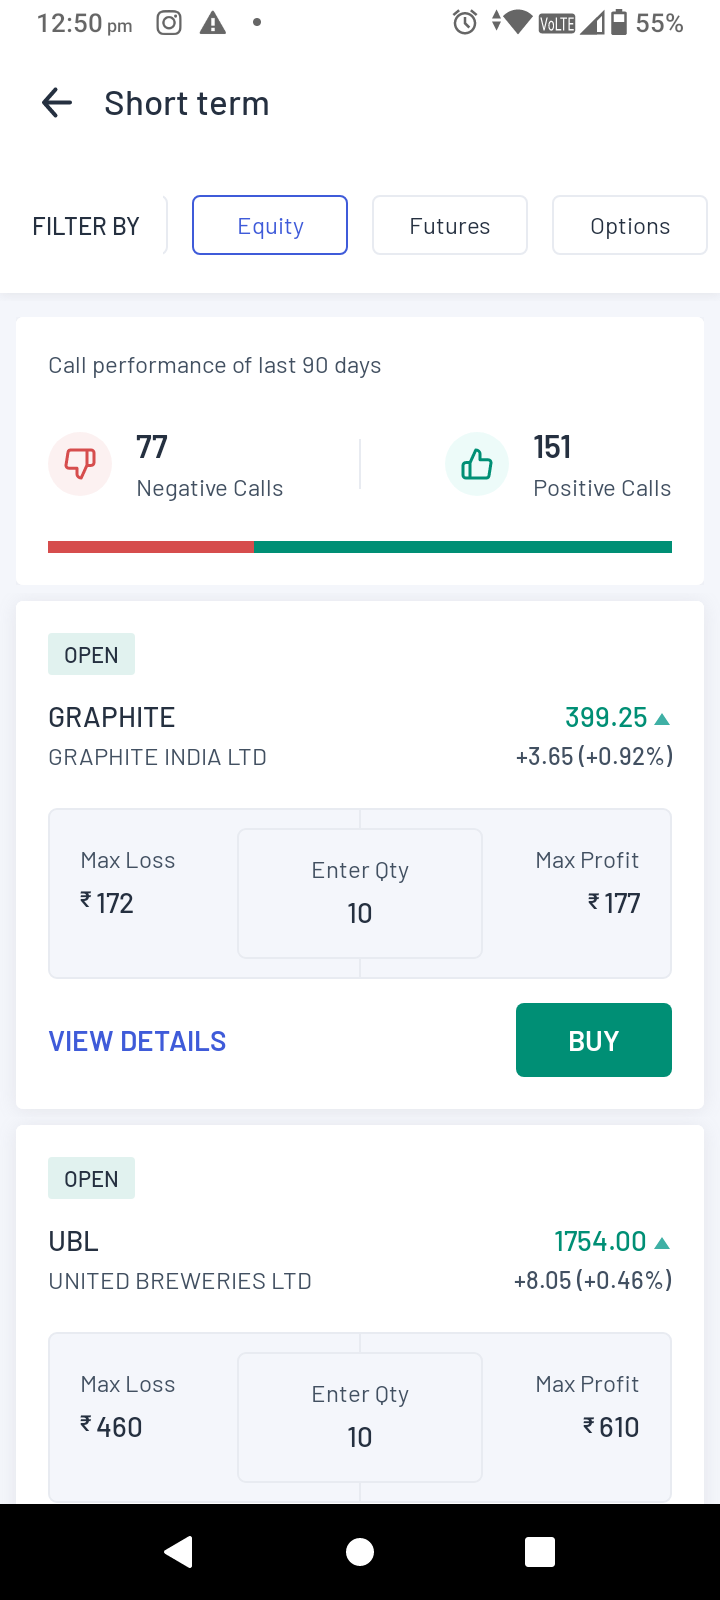
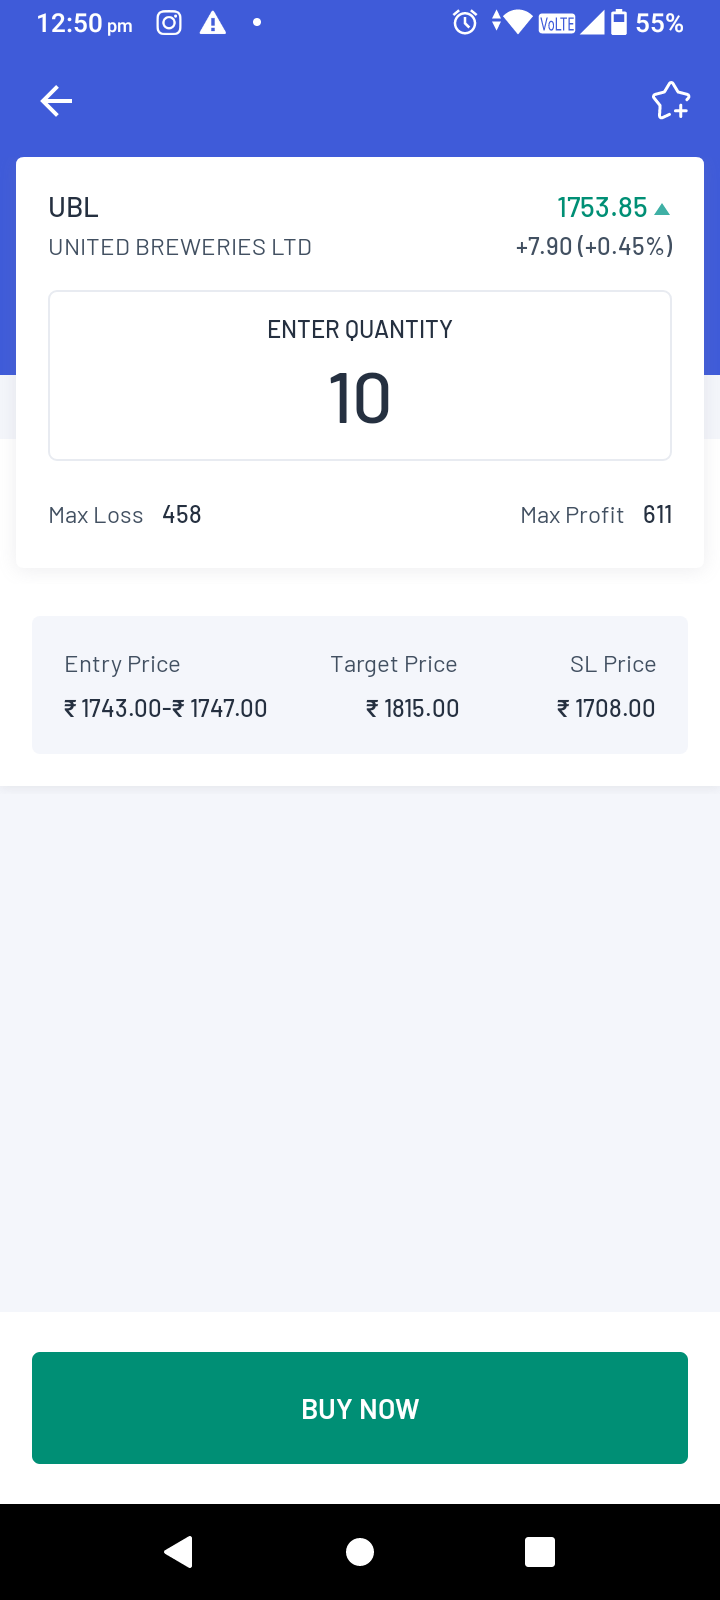
Figure: Stock advisory initial page (left), moving to the Equity section (middle), from which we are viewing UBL stock (right). The same can be repeated for F&O.
Angel One Learning Centre
This section is meant to assist any trader if they need to understand any concepts of trading and investing or just finance in general. The section is divided into 4 subsections for 4 different types of users - beginners, traders, investors and those who are simply trying to explore the app.
The section also leads you to some exciting videos that will help you learn new concepts and app features in a fun and interesting manner.
External Services
The following are brands partnered with Angel One that allow the user to avail special services offered by them via the Angel One app. The external services available to our users are the following -
Smallcase
A Smallcase is a basket of stocks that reflects an idea - the idea could be an objective (e.g. tracking a particular time-based financial goal), it could be a sectoral bet (e.g. stocks of steel and coal companies) and much more. Smallcases could be standardised as per expert suggestions as well as customised as per investor’s requirements. Smallcase is the portal that allows you to handle Smallcases with the greatest efficiency.
You can learn more about Smallcase from here.
Sensibull
It is one of the most advanced options trading apps available in India. The app allows you to develop strategies through virtual trading, backtesting of trading ideas and further analysis of your own strategies.
If you want to know more about Sensibull, kindly click here.
Streak
Streak is a portal that allows users to formulate and put in place systems for stock market trading without having to code algorithms. It allows them to quickly create or copy a strategy, backtest it and deploy it on the market. This is important as it allows users to virtually automate their trading and thus operate by sheer logic rather than emotions and temporary urges.
If you want to explore further on Streak click here.
Vested
It is a US SEC-registered investment advisor that allows Indian investors (including NRIs) to invest in stocks, ETFs and cryptocurrencies in the USA. They also offer ‘Vests’ i.e. curated portfolios for different risk profiles.
In order to know more about Vested, click here.
The Angel One User Manual is your complete guide to navigating our trading and investment platform with ease. Whether you are opening your first Demat account, placing an equity order, setting up an SIP, or applying for an IPO, our step-by-step guides help you understand every feature in detail. From login and dashboard navigation to advanced order types and reports, the user manual ensures you get the most out of Angel One. Designed for both beginners and experienced traders, it brings clarity to every action you take on our platform.
