What Is Efficiency Ratio?
Efficiency ratios are crucial indicators that assess how well a company is utilising its assets, liabilities, and operations to generate income. Management, investors, and analysts use the efficiency ratio formulas to evaluate the performance and competitiveness of a company.
In general, most efficiency ratios show how much returns a company can generate in a given period of time with a given quantity of assets. You can thus think of them as asset efficiency ratios.
Read more about Ratio Analysis
The following are some of the important efficiency ratios, including efficiency ratio formulas, used to assess a company's productivity level.
Inventory Turnover Ratio
Inventory turnover is a significant efficiency ratio that shows how many times a company has sold and replaced its inventory during a particular period. This ratio is essential for businesses that hold inventory, as it helps in understanding whether the inventory levels are optimised for maximum efficiency.
Formula:
Inventory Turnover Ratio = Cost of Goods Sold (COGS) / Average Inventory
Where,
Cost of Goods Sold (COGS) is the total cost of manufacturing goods sold during the period.
Average Inventory = (Total Inventory at the end of last year + Total Inventory at the end of this year) /2
A high inventory turnover ratio indicates that a company is selling and replacing its inventory at a fast pace and not much stock is lying idle i.e. no overstocking. This is particularly beneficial for products that have a short shelf life or are outdated.
However, an extremely high inventory turnover ratio can also have negative implications. If the inventory turnover ratio is too high, it might indicate that the company is not keeping enough inventory on hand to meet the demand. This can lead to stockouts, where the company is unable to fulfil customer orders, leading to lost sales and potentially damaging customer relationships. It can also indicate an over-reliance on just-in-time inventory, making the company vulnerable to supply chain disruptions.
Therefore, while a high inventory turnover ratio can be a sign of efficiency and strong sales, extremely high turnover may indicate potential operational risks. It is also important to consider industry norms, as what is considered a high inventory turnover ratio can vary between different industries.
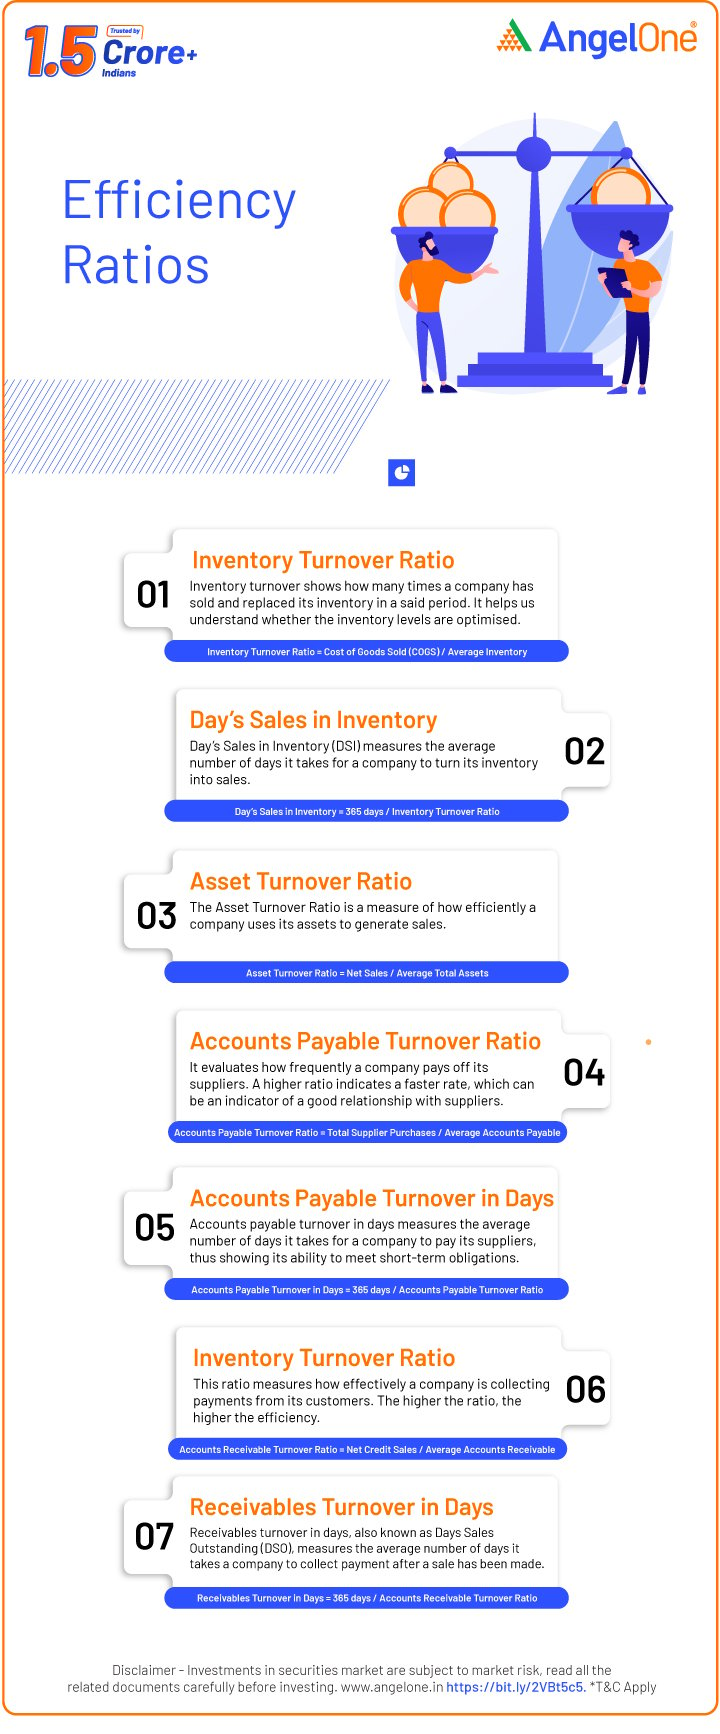
Day’s Sales in Inventory
Day’s Sales in Inventory (DSI) is an efficiency ratio that measures the average number of days it takes for a company to turn its inventory into sales. This ratio helps in assessing how quickly a company is moving its inventory.
Formula:
Day’s Sales in Inventory = 365 days / Inventory Turnover Ratio
A high Day's Sales in Inventory ratio indicates that a company takes longer to sell its inventory. On the positive side, having ample inventory can prevent stockouts, ensuring that customer demands are consistently met, which can be beneficial in certain industries.
However, on the negative side, holding inventory for an extended period can increase carrying costs, tie up capital, and heighten the risk of obsolescence or spoilage. This can particularly affect products with short shelf lives or those subject to rapid changes in consumer preferences. Thus, efficient inventory management is critical.
Asset Turnover Ratio
The Asset Turnover Ratio is a measure of how efficiently a company uses its assets to generate sales.
Formula:
Asset Turnover Ratio = Net Sales / Average Total Assets
Where,
Net Sales is the revenue from sales minus returns, allowances, and discounts.
Average Total Assets = (Total assets at the end of last year + Total Assets at the end of this year) /2
A high asset turnover ratio indicates that a company requires fewer assets to produce the same amount of revenue compared to a company with a lower ratio. This efficiency might stem from superior management, a competitive advantage, or high demand for the company's products.
However, it is important to consider the industry context. In some industries, such as services, a high asset turnover is common due to the low assets required. Comparing the asset turnover ratio with industry benchmarks can provide better insights. Furthermore, an excessively high ratio may also indicate that the company is overextending itself, which might not be sustainable in the long term.
Accounts Payable Turnover Ratio
Accounts Payable Turnover Ratio is an efficiency ratio that evaluates how frequently a company pays off its suppliers. A high ratio indicates that the company is paying off its suppliers at a faster rate, which can be an indicator of a good relationship with suppliers.
Formula:
Accounts Payable Turnover Ratio = Total Supplier Purchases / Average Accounts Payable
Where,
Total Supplier Purchases are the total amounts of goods and services purchased.
Average Accounts Payable = (Total Accounts Payable at the end of last year + Total Accounts Payable at the end of this year) /2
Accounts Payable Turnover in Days
Accounts payable turnover in days measures the average number of days it takes for a company to pay its suppliers. This metric provides insights into the company’s liquidity and ability to meet short-term obligations.
Formula:
Accounts Payable Turnover in Days = 365 days / Accounts Payable Turnover Ratio
A high accounts payable turnover in days means that a company takes a longer time to pay its suppliers. On the positive side, this might indicate that the company is effectively managing its cash flow by holding onto cash for a longer period, which can be used for other investment opportunities or operational needs. It might also mean that the company is taking advantage of favourable credit terms offered by suppliers.
However, on the negative side, a consistently high accounts payable turnover in days could signal that the company is facing cash flow issues, making it difficult to pay suppliers on time. This could strain relationships with suppliers, possibly leading to less favourable credit terms in the future or difficulties in sourcing materials and goods.
It is essential for the company to strike a balance that optimises cash flow without jeopardising supplier relationships. For analysts, it is important to check this metric alongside other metrics such as the quantity of cash and other short-term assets held.
Accounts Receivable Turnover Ratio
The accounts receivable turnover ratio measures how effectively a company is collecting payments from its customers. A high ratio indicates that the company is efficient in collecting its accounts receivables, which can be a positive sign of cash flow and liquidity.
Formula:
Accounts Receivable Turnover Ratio = Net Credit Sales / Average Accounts Receivable
Where,
Net Credit Sales are the total sales on credit minus returns, allowances, and discounts.
Average Accounts Receivable = (Total Accounts Receivable at the end of last year + Total Accounts Receivable at the end of this year) /2
A high accounts receivable turnover ratio indicates that a company is collecting its due amounts quickly. On the good side, this suggests efficient credit management and a positive cash flow, which can be used for business expansion or paying off liabilities.
However, on the negative side, an excessively high ratio may indicate that the company has a very stringent credit policy. This could be limiting its sales by turning away potential customers who might need more lenient credit terms. It is important for a company to balance efficient collections with a credit policy that doesn’t inhibit sales growth.
Receivables Turnover in Days
Receivables turnover in days, also known as Days Sales Outstanding (DSO), is an efficiency ratio that measures the average number of days it takes a company to collect payment after a sale has been made.
Formula:
Receivables Turnover in Days = 365 days / Accounts Receivable Turnover Ratio
A high receivable turnover in days ratio means that a company takes longer to collect payments from its customers. On the positive side, offering customers more time to pay might attract more business and build stronger customer relationships.
However, on the negative side, it indicates that the company's cash is tied up in receivables for a longer period, which could strain cash flow. This can limit the company’s ability to make timely payments, invest in growth opportunities, or handle unexpected expenses. Moreover, a longer collection period increases the risk of bad debts.
Final Words
By now you have probably understood what efficiency ratios are and how the same number for an efficiency ratio can be interpreted in different ways. If you want to start investing in stocks, open a Demat account with Angel One, one of India’s largest and most trusted stockbrokers.
Explore the Share Market Prices Today
| IRFC share price | Suzlon share price |
| IREDA share price | Tata Motors share price |
| Yes Bank share price | HDFC Bank share price |
| NHPC share price | RVNL share price |
| SBI share price | Tata Power share price |
The Indian share market plays a central role in the country's economy by enabling capital formation, wealth creation, and corporate growth. For investors, it offers an opportunity to grow money over time by owning equity in some of the country's most successful companies. Angel One brings the share market to your fingertips with a powerful trading platform, ARQ Prime smart recommendations, IPO access, and research-backed insights. Whether you are starting small or building a long-term portfolio, the share market can be a powerful vehicle for wealth.
