In the financial markets, support and resistance are some of the most extensively used technical analysis approaches. It is a straightforward technique for quickly analyzing a chart to find three items of interest to a trader:
- The market's direction
- Calculating the optimal time to enter a market
- Establishing exit points from the market at a profit or a loss
If a trader can satisfactorily respond to these three questions above, they effectively have a trading idea. Identifying the levels of support and resistance on a chart can help the trader answer such questions.
Support
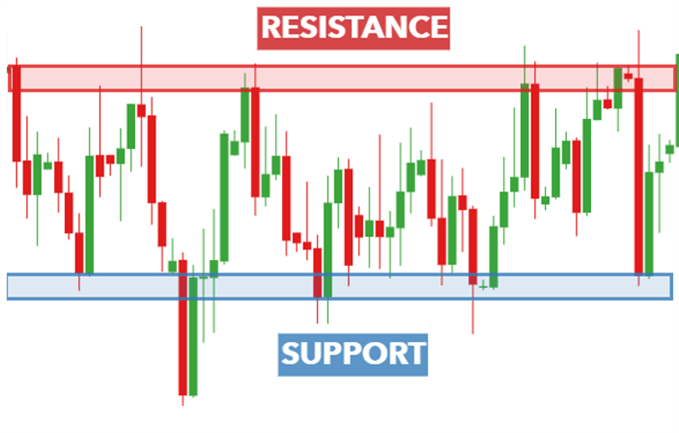
It is a point on a chart where price has fallen but doesn't break below. In theory, support is defined as the price level at which demand (purchasing power) is sufficiently strong to prevent the price from decreasing further. The logic is that as the price approaches to support and becomes cheaper in the process, customers see a better deal and are more willing to purchase, and sellers
become less likely to sell when they receive a less favourable deal. In that case, demand (buyers) will outweigh supply (sellers), and the price won’t fall below the support level.
Resistance
On a chart, resistance is a space where price has risen but has struggled to break above. The chart above illustrates how price rises to the resistance area and then "bounces" violently away from it.
The price point at which supply (selling power) is sufficiently strong to prevent rising prices is referred to as resistance. This is because as the price approaches resistance and becomes more expensive, sellers become more eager to sell, and buyers become reluctant to buy. In that case, supply (sellers) will outweigh demand (buyers), preventing price from rising over resistance.
TRADING STRATEGIES FOR SUPPORT AND RESISTANCE
The following are four of the most effective tactics for trading support & resistance:
Trading in ranges
Range trading occurs between support and resistance levels, with traders attempting to purchase and sell at resistance. Consider the space between support and opposition as a chamber. The floor provides support, while the ceiling provides resistance. Ranges are more prevalent in sideways trading environments where no obvious evidence of a trend exists.
Pro Tip:
Support and resistance levels are not always perfectly straight lines. Occasionally, rather than a perfectly straight line, pricing will bounce off a specific spot.
Traders must establish a trading range, which entails identifying areas of support and resistance. Support and resistance zones can be established, as seen in the chart below:
When a market is range-bound, traders typically seek long entries on bounces off support and short entries on bounces off resistance.
As can be seen, the price has not always followed support and resistance levels, which is why traders should consider putting stops below support when long and above resistance when short.
When price does break out of the set range, it may be a true breakout or a false breakout, often referred to as a "fakeout." When markets break out of their trading range, it is critical to employ solid risk management to limit adverse risk.
Expansion plan (pullback)
Price frequently breaks out and begins trending following a period of directional ambiguity. Traders frequently watch for such breakouts below or over support or resistance to profit from continued momentum in one direction. If this momentum continues to build, it has the potential to spark a new trend.
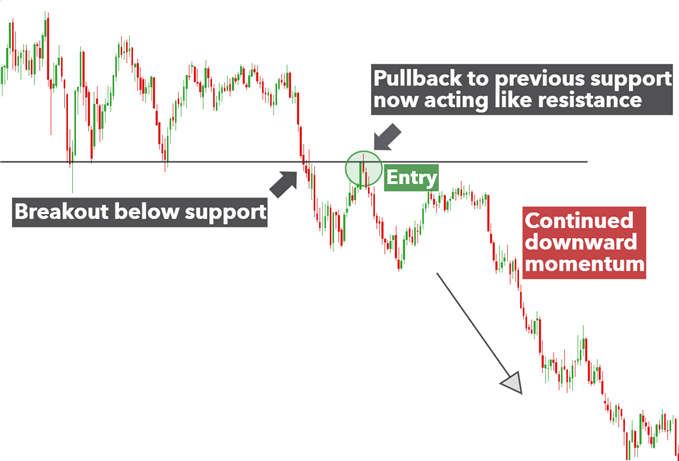
To avoid slipping into the trap of false trading breakouts, top traders typically wait for a pullback (towards support or resistance) before entering a trade.
For instance, the chart below illustrates a solid support level before sellers push the price below it. Numerous traders may become enthused and rush to execute a short transaction early. Rather than that, traders should wait for the market response (buyers seeking to regain control) to collapse before executing a short transaction.
In the scenario below, traders should wait for the market to resume downward following the pullback before seeking entry possibilities.
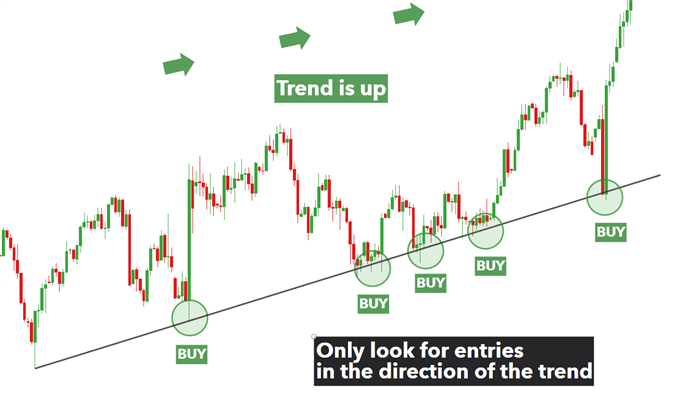
Strategy based on trendlines
The trendline technique makes use of the trendline to determine if it is a support or resistance line. Link two or more highs in a downtrend with a line or two or more lows in an uptrend with a line. Price will bounce off the trendline in a strong trend and continue to move in the direction of the trend. As a result, traders should hunt for higher probability bets exclusively in the direction of the trend.
Strategy based on moving averages
Using moving averages as a means of determining support and resistance.
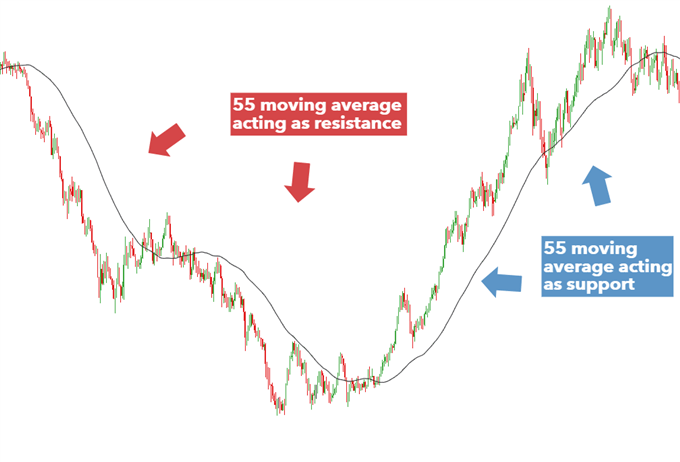
Moving averages can act as psychological support and resistance simultaneously. The most frequently used moving averages are the 20 and 50-period moving averages, which can be significantly modified to 21 and 55 to incorporate Fibonacci values. Traders frequently integrate the 100 and 200 MAs, and ultimately, it is up to the trader to choose a comfortable setup for them.
As illustrated in the chart below, the 55 MA first tracks above the market, acting as a resistance line. The market then bottoms and reverses, with the 55 MA serving as a dynamic support. Traders can use these trendlines to determine which markets are likely to continue trending and ripe for a breakthrough.
Learn Free Stock Market Course Online at Smart Money with Angel One.
The Indian share market plays a central role in the country's economy by enabling capital formation, wealth creation, and corporate growth. For investors, it offers an opportunity to grow money over time by owning equity in some of the country's most successful companies. Angel One brings the share market to your fingertips with a powerful trading platform, ARQ Prime smart recommendations, IPO access, and research-backed insights. Whether you are starting small or building a long-term portfolio, the share market can be a powerful vehicle for wealth.
