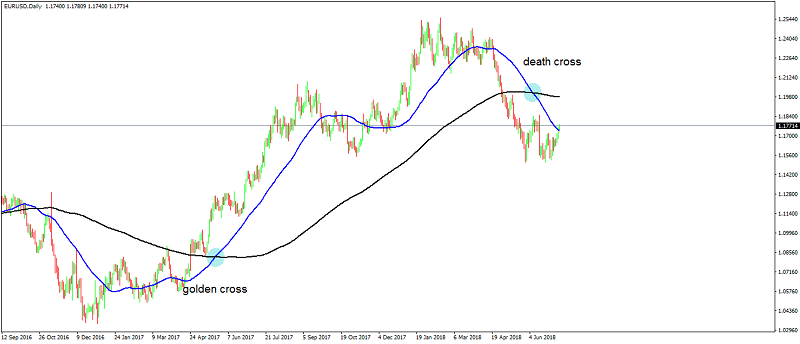
What is a sign of a stock that investors are bullish about? It is the Golden Cross in the stock price chart.
What is a Golden Cross?
When a stock’s short-term Moving Average (MA), say 50-days climbs above the long-term (200 days) it shows up on the technical charts as the Golden Cross in stocks. It signals a bullish turn in sentiments. In other words, the shorter-term MA is rising faster than the longer-term until it catches up with the latter. This movement shows the stocks are breaching the support levels of long-term MAs to make new highs. A moving average is the average of closing prices of shares over a given period.
Why does A Golden Cross Indicate Bullishness?
Experts maintain that if short-term MA prices breach the long-term moving averages and stabilise there, the stock could bag a 5-7 percent gain. In a golden cross chart, you will see the eventual bottoming out of stock prices before they start soaring upwards and steady above the long-term moving average.
This stabilising effectively indicates investors are bullish about stock prices and expect prices to remain at similar levels or rise further. In a golden cross, the long-term moving average turns to be the support level for the prices and the golden cross remains as long as the prices trade above the long-term moving average. Positive sentiment about a particular stock brings in more investor interest and builds buying opportunities at those levels. As the two trend lines align and as long as short term MA cruises above the long-term MA, experts suggest the bullish sessions are likely to last for some time. As the trading volume rises, the upward trend in stock prices gathers steam. But when the short-term moving average moves below the support level, it gives way to a new technical chart pattern called the death cross.
The purpose of moving averages is to indicate the bullish markets from the bearish ones. When markets are bullish like as indicated by a golden cross, traders look to buy with slightest dips in prices, and when markets are bearish like a death cross indicates, buyers sell when prices spike even a little bit. This way, both the golden cross and death cross, work as trading strategies themselves since traders can simply follow the trends indicated by these two technical chart patterns.

Drawbacks Of Golden Cross
More often than not, golden crosses have rightly predicted significant bull markets but not always. It is quite possible that a golden cross may not sustain, in which case if you take a long position relying on the golden cross alone, you may be in for some setback in the short run. So, a golden cross must be reinforced by similar trends in other indicators and filters, before taking a trading position.
Conclusion:
To make a better decision following a golden cross, you can look at a stock in a current golden cross that had a long downtrend before bottoming out and rising again. When a stock enters a golden cross after having seen multi-years of a bearish death cross, it can be a strong sign of trend reversal. Yet another option is to look for a double bottom that is the stock on both the moving averages breaches the same lows before moving into a golden cross. Once the golden cross is formed, wait it out for the prices to test the long-term moving average as support levels. Then you can know fairly well how strong the rally predicted by the golden cross is likely to be.
Learn Free Stock Market Course Online at Smart Money with Angel One.

