What is covariance?
Covariance is the direct relationship between the returns from two different asset classes. Statistics is a great way to understand and evaluate stocks. Although covariance, one such famous statistical concept, can be applied to anything, in trading its variables are two different stocks. A formula that tells you how to find the covariance between two stocks can help predict how well they perform compared to one another. Particularly, in portfolio management, covariance is especially helpful as a statistical measure.
It can be used to determine which assets one can one should include in a portfolio. The way covariance works to measure returns is that when two stocks move in the same direction, the covariance is positive. When two stocks move in the opposite direction, covariance is negative. When it comes to one’s portfolio, the manager will ideally select stocks that work well together which means they do not covary together. Hence, when constructing a portfolio, the goal is to add diversity by choosing stocks that have negative covariation.
How to calculate covariance?
To calculate covariance, one requires a list of the stock’s prior returns. These are referred to as historical returns on most quote pages. One uses the closing price of each day to find the historical returns of a stock. This needs to be done for both the stocks one wants to see the covariance between. Let’s assume the daily return for Stock X looks like this: 1.1%, 1.7%, 2.1%, 1.4%, and 0.5%. On the same days, Stock Z showed the following returns: 3.0%, 4.2%, 4.9%, 4.1%, 2.5%.
- The first step in calculating covariance is to take the average of both these stocks’ performance in the last five days. The average of Stock X is 1.30% and for Stock Z it is 3.74%.
- Each of the five values for each stock needs to be subtracted from their respective averages and the difference needs to be charted.
- The difference between X’s return and its average and the difference between Z’s return and its average need to be multiplied, as do all other corresponding differences.
- Now there will be five multiples remaining which need to be added up.
- This summation needs to be divided by the overall size of the sample taken minus one. The sample size was 5 (days) in the aforementioned example. Hence, the summation will be divided by 5 -1 = 4. This formula will yield the following covariance for the aforementioned numbers: 0.665.
- This is a positive number meaning the stocks are correlated positively. They are moving in the same direction to a reasonably strong degree. If Stock X had a high return, then Stock Z is also likely to yield high returns.
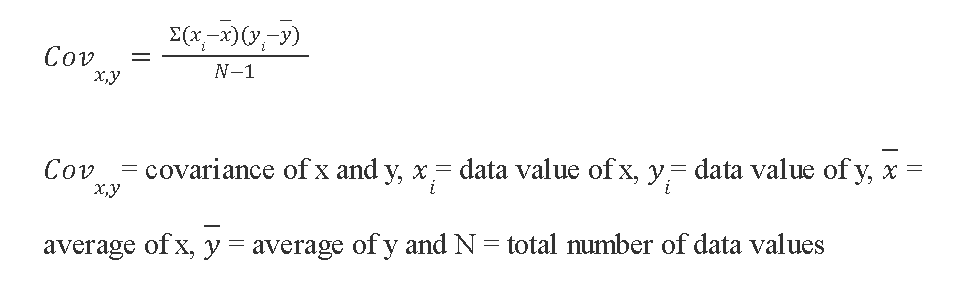
The formula for covariance is:
Interpreting Covariance
Now that we understand how to find covariance between two stocks, let’s address how to best interpret covariance to avoid misunderstanding it. In the example taken above, there is a reasonable degree of positive covariance so it’s fair to interpret that the stocks move in the same direction. If the result were negative, one stock would show a positive response while the other would perform negatively.
Interpreting covariance is incomplete without looking at correlation. Two stocks may have low or high covariance but to determine the strength between their relationship, correlation is an essential tool to consider. This is why correlations are used in conjunction with covariance. Values for correlation range anywhere between -1 and 1. A negative one is the strongest possible negative correlation meaning that the stocks have absolutely no relationship with one another. While a positive one is the strongest possible positive correlation meaning the stocks always correlate with each other.
Variance
When one reads the word ‘variance’, the first idea that strikes the mind is the divergence of something from a level that is considered normal. In statistics, the variance is the spread of a data set from its mean value. Larger variance means that the numbers in the data set are farther from the mean, while smaller variance means the numbers are closer to the mean.
The concept of variance is used in the financial markets to gauge the volatility of a stock. The variance indicates how far a stock can move from its mean. A stock with higher variance is riskier but may generate higher returns and vice versa.
Variance vs Covariance
With the concept of variance and covariance fairly clear, let us take a look at the differences between variance and covariance. With either the terms used for investing or more precisely, for portfolio allocation, what is the difference between variance and covariance? The basic difference between variance and covariance is the information that each provides. Variance is a value describing a single variable. It is a measure of magnitude of variation. On the other hand, covariance tells about the directional relationship between two variables.
If you dive deeper into variance vs covariance, you will understand both serve different purposes. The value of variance is interpreted to gauge the risk associated with an investment. It is a rough measure of the volatility of a security’s price. On the flipside, covariance is interpreted as the relation of the returns of an asset to those of others. Covariance can be used to diversify your portfolio. Add assets with negative covariance in your portfolio. When the returns from one will turn negative, the returns from the other will be positive, balancing the portfolio.
Conclusion
Using the tool of covariance is an easy way to get insight into whether the movement of one stock can predict the movement of others in a portfolio. Investors try to mitigate risk in their portfolio by adding stocks that are negatively covariant, meaning when one is performing well, the other is likely underperforming. Covariance has its drawbacks as it is fairly complicated to learn how to calculate covariance manually, without the assistance of a tool or online calculator. Stocks can be covariant but knowing how strong the relationship between them is (correlation) can aid in predicting how consistent their covariance will be across time.
Learn Free Stock Market Course Online at Smart Money with Angel One.
