In equities trading, timing is everything. How do you know when you have held on to a trading strategy for longer than you should have?
Among the various trading strategies, a popular one is the equity curve trading strategy where the trader follows an equity curve to decide when it is a good time to press pause.
What Is An Equity Curve?
An equity curve is a visual or graphical depiction of how your trading account has grown over time. To put it simply, it shows you graphically whether a particular trading strategy is paying off or not. Based on how the equity curve looks, you can choose to put a plan on hold when it hasn’t paid off in a predetermined time. So, for example, if an equity curve shows a positive upward slope, you know the strategy is paying off. If the slope is negative, then you know that, during the given period, the strategy hasn’t paid off.
Example Of An Equity Curve
Let us understand an equity curve using a simple hypothetical example that consists of two different strategies.
Investor A has a trading account of Rs.50,000. Between January and May, his approach has returned him decent profits every month, but since June, he has been incurring net losses. In the first column on the left are the months A has traded with strategy 1, second left column is his net profit or loss each month, the second column from the left is the cumulative profit, and the third column is how his trading account has grown based on the profit or loss each month.
| Month | Net Profit/Loss (in rs.) | Cumulative profit/loss (In Rs.) | Trading Account Value (in rs.) |
| January | 2000 | 2000 | 52000 |
| February | 4000 | 6000 | 56000 |
| March | 6000 | 12000 | 62000 |
| April | 8000 | 20000 | 70000 |
| May | 10000 | 30000 | 80000 |
| June | -5000 | 25000 | 75000 |
| July | -3000 | 22000 | 72000 |
| August | -4000 | 18000 | 68000 |
The equity curve can be plotted based on the cumulative profit or loss or the trading account value. We will see how the graph looks for strategy 1 by plotting both separately.
Equity Curve For Strategy 1 based on the trading account value
| Month | Trading Account Value (in rs.) |
| January | 52000 |
| February | 56000 |
| March | 62000 |
| April | 70000 |
| May | 80000 |
| June | 75000 |
| July | 72000 |
| August | 68000 |
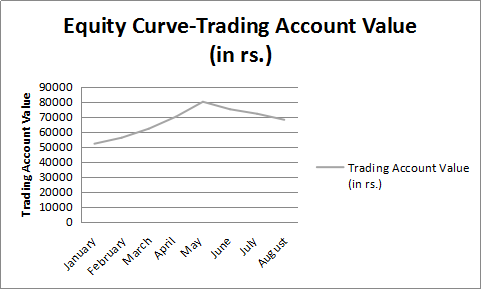
You can see how your equity curve has moved over the period between January and August.
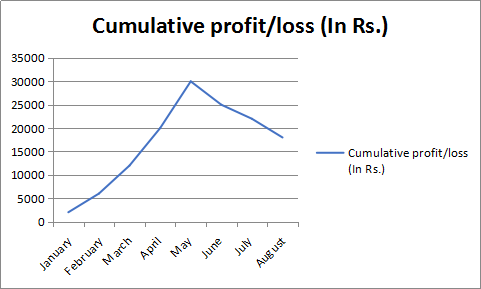
Similarly, you can have an equity curve by plotting the cumulative loss or profit of the strategy.
| Month | Cumulative profit/loss (In Rs.) |
| January | 2000 |
| February | 6000 |
| March | 12000 |
| April | 20000 |
| May | 30000 |
| June | 25000 |
| July | 22000 |
| August | 18000 |
Now suppose investor A decided that strategy 1 is no good since it has stopped paying off. He employs another trading strategy that is not immediately profitable but eventually, as the markets turn, begins to return profits for him. Let us plot the equity curve for strategy 2.
| Month | Net Profit/Loss (in rs.) | Cumulative profit/loss (In Rs.) | Trading Account Value (in rs.) |
| January | -2000 | -2000 | 48000 |
| February | -4000 | -6000 | 44000 |
| March | -5000 | -11000 | 39000 |
| April | -6000 | -17000 | 33000 |
| May | -7000 | -24000 | 26000 |
| June | 5000 | -19000 | 31000 |
| July | 10000 | -9000 | 41000 |
| August | 15000 | 6000 | 56000 |
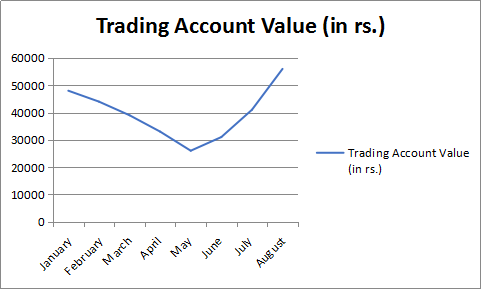
Let us first plot the equity curve for strategy 2 based on changes in the trading account value.
| Month | Trading Account Value (in rs.) |
| January | 48000 |
| February | 44000 |
| March | 39000 |
| April | 33000 |
| May | 26000 |
| June | 31000 |
| July | 41000 |
| August | 56000 |
Equity Curve For Strategy 2’s Trading Account Value
Plotting the EC for changes in cumulative profit and losses for strategy 2.-
| Month | Cumulative profit/loss (In Rs.) |
| January | -2000 |
| February | -6000 |
| March | -11000 |
| April | -17000 |
| May | -24000 |
| June | -19000 |
| July | -9000 |
| August | 6000 |
Equity Curve based on cumulative profit or loss for strategy 2.
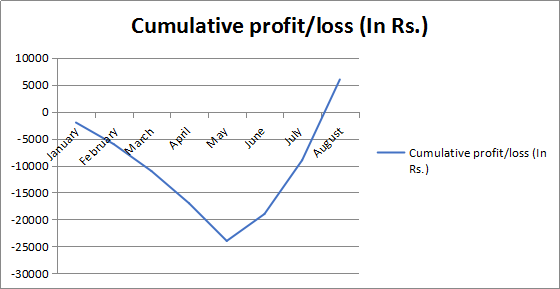
You can see from the graph; the inflexion points are distinctly clear for the second strategy here, that is, in August the cumulative gains are positive, though the approach starts reducing its losses since June.
What Is Equity Curve Trading?
In equity curve trading, traders apply a moving average to the curve. The idea is when the equity curve drops below the moving average, the strategy is put on hold. This is done to stop losses when either the hopes of the plan working start dimming or when the trader knows he cannot afford more losses on a strategy. The trader can resume trading this particular strategy when the equity curve is above the moving average.
Conclusion:
Equity Curve Trading puts an investor at the ease of knowing that his investment is covered even when he is not actively tracking his strategy. When the equity curve dips below a level investor is comfortable with, it can be paused until such time that the equity curve is back above the determined moving average.
Explore the Share Market Prices Today
| Tata Steel share price | Adani Power share price |
| PNB share price | Zomato share price |
| BEL share price | BHEL share price |
| Infosys share price | ITC share price |
| Jio Finance share price | LIC share price |
Online share trading has transformed the way Indians invest in the stock market. With just a smartphone or laptop, you can buy and sell shares from anywhere, anytime — without paperwork or visits to a broker's office. Angel One's online trading platform gives you instant access to NSE, BSE, MCX, and NCDEX, advanced charting tools, real-time price feeds, and ARQ Prime AI-powered investment recommendations. Whether you want to invest for the long term or trade actively, online share trading puts the power of the markets directly in your hands.
