Definition of ratio analysis
Ratio Analysis is a quantitative method of evaluating the profitability, efficiency, liquidity, solvency and potential growth of a firm by external investors using its financial statements. It gives you insight on a company's financial health.
What are the different categories of ratio analysis?
Liquidity Ratios: This type of ratio assesses an organisation’s ability to deal with short term debt by liquidating its current assets. These types of ratios in ratio analysis are used by financial lending institutions, suppliers and banks to assess whether an organisation is capable of honouring its financial obligations in time. Some liquidity ratios include quick ratio, cash ratio, working capital ratio, and the current ratio.
Solvency Ratios: These ratios are also referred to as leverage ratios in that they estimate a firm’s ability to manage its financial commitments and conduct business in the long term. This is done by weighing a company’s outstanding debts with interest against parameters such as its equity, assets or earnings to gauge whether they will be able to pay these off in due time while staying profitable. They are often used by governments, banks and investors. Different types of ratio analysis under this category include debt-equity ratios, equity multiplier, and debt-assets ratios.
Coverage Ratios: Coverage ratios help in determining a business’ ability to pay off debts and the interest generated by them. Higher ratios indicate a higher capability to fulfil such obligations. Times interest earned ratio, fixed coverage, interest coverage and the debt-service coverage ratios are examples of this category.
Efficiency Ratios: Also known as turnover ratios, these types of ratios in ratio analysis are used to judge the degree of efficiency in a company’s handling of its assets, liabilities, equity and inventory in order to generate profits. Some important efficiency ratios include asset turnover ratio, inventory turnover, payables turnover, working capital turnover, fixed asset turnover, and receivables turnover ratio.
Profitability Ratios: Profitability ratios evaluate a firm’s ability to generate profits concerning operating costs. Increases in these types of ratios over time are often indicative of improving financial performance. Comparisons of these ratios between similar organisations in the same sector can be used to gauge relative performance against the prevailing economic climate. Profit margin, return on assets, return on equity, return on capital employed, and gross margin ratios are examples of these types of ratio analysis.
Market Prospect Ratios: Finally, market prospect ratios, also known as earnings ratios, are used by investors to estimate earnings on investments. These earnings can come in the form of growing dividends or appreciation of equity value. Dividend yield, earnings per share, the price-to-earnings ratio, and the dividend payout ratio are part of this category and are some of the most commonly used types of ratios in ratio analysis.
Significance of ratios
- Ratio analysis can help us understand the underlying business intelligence of a financial statement.
- Analysis over many reporting periods can help in detecting trends and relationships while being used to project future developments or identify risks.
- If you plan to invest in certain equity or debt, it can help you predict wealth gains and dividend pay-outs in the long-term, thereby helping you choose the right stock.
How to evaluate a stock: The Approach
There are two approaches on how to evaluate a stock. First is the Fundamental Analysis of stocks which is aimed at mapping the intrinsic value of a stock, and the other is Technical Analysis, the study of a stock’s price action.
Let’s get to know each one of the approaches briefly:
Fundamental analysis
“Knowing the premise on which the company is working”
It involves metrics like revenue growth, profit margins, return on equity, future growth potential, financial highlights, management discussions, etc.
Four key financial ratios to help with stock evaluation:
For Ace investors, it’s not enough that a company is posting overwhelming profits. They are equally watchful about the company’s performance as measured by the following indicators:
P/E Ratio
It’s the amount of money an investor is willing to pay for Re 1 earning of the company. It gives the relationship between the current share price and the earnings of a company. P/E ratio tells if the stock is overvalued or undervalued.
The formula for P/E Ratio is: Share Price/ Earnings per share
You don’t need to do the math to find the P/E Ratio for each stock you come across. You can easily find it under ‘ Stock details->Fundamentals’ on the Angel One app.
Earning Per Share (EPS)
It’s an indicator of the profitability of the company. It is obtained by dividing the company’s net income by the total outstanding shares of the company.
Though it’s not a thumb rule, “The higher the EPS, the better.”
Suppose company X has total earnings of Rs 500 cr and decides to pay all its earnings to its 10 lakh shareholders. Here, the EPS would be the company’s total profit divided by the number of shares, i.e., Rs 50 per share.
Dividend Payout Ratio(DPR)
This describes the portion of earnings that the company pays to its shareholders as a reward for staying invested in the company.
DPR = Dividend paid / Net annual earnings
For example, a company ‘A’ earns Rs 100 and pays out Rs 20 as a dividend. DPR for company ‘A’ would be 20%.
Alternatively, the ratio for dividend payout can also be calculated using the metric of retention ratio as follows:
1 – Retention Ratio = Dividend Payout Ratio
Companies still in their growth stage tend to reinvest the money, therefore the DPR may be low. Over time, a payout ratio that is steadily rising could indicate a healthy and maturing business. But if it has a payout ratio of over 100%, a company will be returning more money to shareholders than it is currently earning. Such a situation is not financially sustainable.
Retention ratio and dividend payout ratio are converse to one another, as shown by the payout ratio formula. The retention ratio represents the percentage of profits earned, either retained or reinvested.
It is vital to know the difference between dividend yield and dividend payout. Dividend yield reveals the simple return rate, which is seen in cash dividend payouts to shareholders. On the other hand, the dividend payout rate represents the company’s net earnings, most of whom should be paid out as dividends.
Price to Book Value or PB ratio
It’s the ratio of market capitalization and the book value of a share. The book value is the net of assets held by the company over its liabilities. Mathematically, PB ratio can be expressed as: P/B ratio = Market price of the share / Book value of assets per share.
Value investors are always looking for stocks with low PB ratios. Because of investing in those stocks, they’ll be paying less for more book value.
Technical Analysis
Traders use technical analysis to get insights into the projected future price levels of stocks, based on how they performed in the past. Traders apply various technical analysis tools like RSI and MACD, support and resistance levels, and breakout levels.
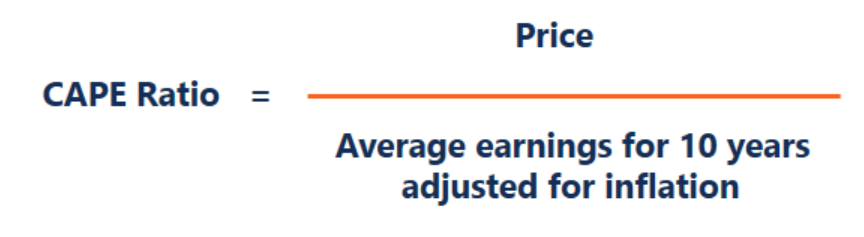
CAPE Ratio
CAPE ratio is a valuation measure of calculating real P/E ratio over a 10 years period to smooth out any fluctuation in company profit caused by the business cycle. CAPE is an acronym that stands for cyclically adjusted price-to-earnings ratio. It is also called Shiller P/E ratio after the name of American economist and Nobel laureate, Robert Shiller, the man behind popularising CAPE.
The formula used in calculating Shiller P/E ratio is below
What Does Shiller P/E Ratio Tell You?
Similar to the P/E ratio, it is also a measure to identify if a stock is overvalued or undervalued. It gives a broader image of a company’s performance by smoothing out cyclical effects. Previously, the CAPE ratio gave warnings regarding market bubbles and crashes.
Criticism of CAPE ratio
Some experts have pointed out that CAPE ratio is backwards-looking since it is calculated on historical data.
Next, the formula uses GAAP (generally accepted accounting principles). However, accounting reporting rules have undergone significant changes since the formula was developed. So, a CAPE ratio calculated using GAAP principle may not give an accurate value.
Sharpe Ratio
Sharpe Ratio is the difference between the return of an investment and the risk-free return (known as the excess return) divided by the standard deviation of the investment. It adjusts the performance for the excess risk that was taken by the investor. It can be used to evaluate the performance of a share against the risk. Sharpe Ratio can compare two funds that have the same risks or the same returns or to a benchmark, which can help the investor understand how well he will be compensated.
How to calculate Sharpe Ratio?
Sharpe Ratio= (Rp−Rf)/ Standard Deviation of the fund return
where,
Rp=return of a portfolio,
Rf=risk-free rate,
The standard deviation shows the relationship between the Sharpe ratio and risk. It is also known as the total risk. If the funds have the same returns, the shares with a higher deviation will have a lower Sharpe Ratio.
Why is Sharpe Ratio important?
The Sharpe Ratio shows how much compensation the investor can get for investing in a risky stock than a risk-free stock. A negative Sharpe ratio can mean the risk-free rate is greater than the stock’s return, or the stock’s return is expected to be negative. The Sharpe ratio of a risk-free asset is zero.
In the case of a diverse portfolio, if the assets have low to negative correlation, it may reduce the overall portfolio risk and increase the Sharpe ratio.
Limitations of Sharpe Ratio
- The ratio has to be calculated by comparing funds to other funds or a benchmark.
- The standard deviation assumes the normal distribution of returns. This is not as beneficial when the distribution is asymmetrical.
- Sharpe ratio can be manipulated by portfolio managers to boost their risk-adjusted returns history.
- Sharpe ratio cannot distinguish between upside and downside and focuses on volatility but not its direction. Price movements in either direction are equally risky.
Efficiency Ratios
Efficiency ratios may be defined as a measure of a company’s capabilities with regards to using its resources to maximise its earnings.
Types of efficiency ratios
The following four ratios are most commonly used on fundamental analysis of stocks:
Inventory turnover ratio
The formula for inventory turnover ratio is cost of goods sold divided by average inventory
A higher inventory turnover means that goods are being sold quickly and less stock is sitting idle. The average inventory is arrived at by taking an average of the cost of goods during two or more specified time periods. It usually includes at least beginning inventory balance and closing inventory balance of the same year.
Asset turnover ratio
The formula for asset turnover ratio is net sales divided by average total assets. Higher the ratio, higher the revenue for a given cost of assets.
You can find net sales on the company’s balance sheet but do remember to deduct returns and refunds from this amount. Average assets can be arrived at by adding assets at the start and end of the fiscal and dividing it by two.
Accounts receivable turnover ratio
The formula for accounts receivable turnover ratio is net credit purchases divided by average accounts payable
This ratio tells you how quickly a company is paying off suppliers. Early payment allows companies to get discounts; late payment could attract penalties. An inability to pay dues on time is a red flag overall.
Accounts payable turnover ratio
The formula for accounts payable turnover ratio is net credit sales divided by average accounts receivable
You’re looking for a higher ratio as is the case with any other efficiency measure and like its accounts receivable counterpart, here too it makes sense to compare the company’s current efficiency levels with historical levels.
Price-to-Sales Ratio – Meaning
The price-to-sales (or P/S) ratio is a ratio used to set the price of a company’s stock against its revenues. This ratio is commonly referred to as a revenue multiple or a sales multiple.
Examining the Price-to-Sales Ratio
With this ratio, it is possible for analysts to understand how much money investors are willing to pay per Rupee of sales. In order to calculate this ratio,
Divide the company’s market capitalization by the total number of their sales for a specified time frame which is ordinarily twelve months.
The price-to-sales ratio can also be determined for a single share by dividing the stock price by the sales per share for the company in question.
The P/S ratio is ideal for drawing comparisons between companies belonging to the same sector. Companies that have a low P/S ratio are likely to have stock that is undervalued whereas companies that have P/S ratios that significantly exceed the average may be overvalued.
When looking at the time frame used to assess the P/S ratio, the ordinarily used 12-month time frame is spread across the previous four quarters that are often referred to as the trailing 12 months or TTM. Else, this 12-month time frame applies to the most recent fiscal year (or FY). In the event that a P/S ratio is ascertained keeping in mind forecast sales for the current year, it is referred to as a forward P/S ratio.
As an equation, the price-to-sales ratio can be formulated as follows.
P/S Ratio = MVS / SPS
Where MVS = Market value per share and SVS = sales per share (sales per share metric is found by dividing the company’s sales by the number of outstanding shares they have).
This ratio does not take into account a company’s debt loads or the status of said company’s balance sheet.
EV/ Sales – A Superior Ratio
In contrast to the P/S ratio, the enterprise-value-to-sales ratio (or EV/ Sales) takes into account a company’s debt. It does so by employing the enterprise value of a company as opposed to its market capitalization. This value adds to the debt and preferred shares to the market capitalization and reduces the cash from this figure. The EV/ Sales ratio is understood to be more advanced however it involves more calculations and information needed to calculate it isn’t always easily accessible.
