A symmetrical triangle chart pattern primarily symbolizes a volatility contraction in the market. In other words, the market’s volatility is slowly shrinking and may soon break out or break down. This pattern is observed when a share’s price is consolidating in a manner that generates two converging trend lines with closely aligned slopes. This chart pattern itself shows an ongoing period of share price consolidation before it is forced to break down or break out. If the lower trendline experiences a breakdown, this marks the beginning of a new bearish trend. Alternatively, if the upper trendline experiences a breakout, this implies the beginning of a new bullish movement.
What does a symmetrical triangle pattern look like?
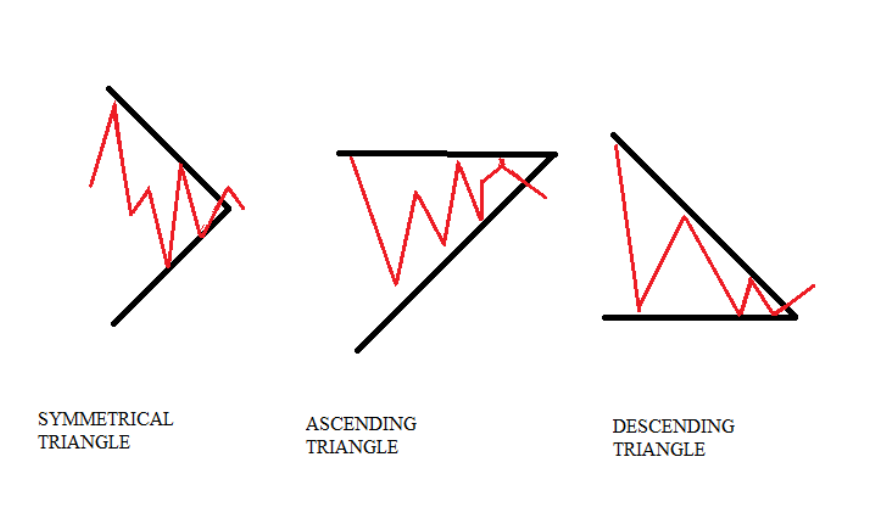
A chart pattern that features two trend lines converging such that they connect in a series of peaks and troughs is a symmetrical triangle pattern or wedge chart pattern. Both trend lines should converge at a roughly equivalent slope, hence giving the shape of a triangle. If both the trend lines converge at an unequal slope, then they are no longer symmetrical. These lines are referred to as ascending or descending triangles.
Many trading experts admit that one way to identify a symmetrical triangle is to see the duration of the trendline. This is because whether or not the trend has been observed for days or months can confirm whether the pattern is a symmetrical triangle pattern or just a temporary flat or pennant. In general, if the pattern is observed over months it is most likely a symmetrical triangle. If it is just a few weeks old, then it is probably a pennant or a flag.
How to infer the breakout price from a symmetrical triangle pattern?
Traders use the distance from the low and high of the earliest section of the pattern as a means to estimate the breakdown or breakout price point. For instance, let’s say that the symmetrical triangle pattern begins at a low of ₹10.00 and continues to move upwards to ₹15.00 before this range begins to narrow. A breakout as seen at ₹12 would imply a target price of ₹17. The underlying formula is ₹15 — ₹10= ₹5 + ₹12 = ₹17.
Estimating a breakout point also helps in knowing where to place one’s stop loss. Normally, in a symmetrical triangle chart pattern, the stop loss is placed right before the breakout point. For instance, assuming the aforementioned share breaks out on high volume from ₹12.00, traders will usually place their stop-loss right below ₹12.00 to minimize any potential losses. It is also crucial to note that, as with most forms of technical analysis, symmetrical triangle trading works best when one analyses other technical indicators and patterns as well.
Tips to Trade Using a Symmetrical Triangle Pattern
Symmetrical triangle technical analysis works best in conjunction with different chart pattern analyses. Using symmetrical triangles patterns, traders typically are looking for a high volume movement in a share price so they can confirm its breakout. Other indicators can help estimate the duration of that breakout. For example, RSI or the ‘relative strength index’ is usually used in conjunction with symmetrical triangle technical analysis to estimate when a security has become overbought after its breakout.
Traders also use moving averages in conjunction with a symmetrical triangle chart pattern to trail their stop loss. Besides using a trailing stop loss technique, traders often use a price projection technique when using a technical indicator like a symmetrical triangle. Here’s how price projection works. First, calculate the distance between the lowest point and highest point of the symmetrical triangle pattern. This is its width. ‘Copy-paste’ this width at the breakout point. Now you can exit your trade at a price projection level.
Further Features
- A symmetrical triangle chart pattern occurs when the share price consolidates in a manner that generates two converging trend lines with roughly equal slopes.
- Both breakdown, as well as breakout targets for a symmetrical triangle, are equal to the distance between the initial low and initial high applied to these respective points.
- Traders use symmetrical triangles in conjunction with other types of technical analysis tools to help confirm their estimates about potential breakout points.
Ascending Triangle Pattern
An ascending triangle is usually considered a continuation pattern. This means that the pattern remains significant if it occurs within both a downtrend and an uptrend. Once breakout from the triangle occurs, traders are quick to aggressively sell or buy the assets depending upon the direction in which the share price first broke out. Growing volume helps to confirm whether or not the price has broken out. The more the volume increases the more interest in the price moves outside of the pattern.
To form an ascending triangle’s main trendlines, at least two swing lows and two swing highs are necessary. However, a greater number of trendlines converging to touch each other is indicative of more reliable trading results. Since both trendlines are converging into each other, if the share price keeps moving within this triangle for many swings, its price action will grow more coiled, eventually leading to a stronger breakout.
It is common for the share’s volume to be stronger during trend periods than consolidation ones. As an ascending triangle chart pattern is a kind of consolidation, the volume of shares tends to contract somewhat during this time. As mentioned earlier, traders seek out an increased share volume close to a potential breakout point. If the volume suddenly starts increasing, this helps to determine that the security is reaching a potential breakout point.
On the other hand, if the share’s price breaks out on a lower volume, this signals a warning sign that the breakout will lack in strength. This indicates that the price could move back into the pattern, otherwise known as a ‘false breakout’. Hence, it is crucial that traders who are ascending triangle trading keep an eye out on the share volume when determining where the breakout point will be.
For the purpose of trading, an entry is usually considered when a share price breaks out. The unspoken rule among traders is that one should buy if the share’s breakout occurs on its upside, and sell/short their trades if the breakout occurs on the security’s downside. To aid in reducing one’s potential losses, a stop loss is placed right outside the ascending triangle chart pattern. For instance, suppose a trader takes a long trade on an upside breakout, she will place the stop loss just below the triangle’s lower trendline.
It is also quite easy to estimate a profit target from an ascending triangle pattern. This is usually done by subtracting or adding the height of this triangle – depending on its direction – from the breakout price. In other words, the ascending triangle pattern’s width is used. Let’s say the triangle has its broadest width at ₹50. This value will be added to the upside breakout point to get a proper estimate of the profit target. On the other hand, this same value is subtracted from the price if it breaks on the downside.
One limitation of this chart pattern – which is true for most technical indicators – is its potential for giving false breakouts. In some cases, the share price moves outside of the pattern and even proceeds to break out of the price only to re-enter it. In other cases, an ascending triangle pattern may be redrawn many times without generating any momentum as its price skirts past trend lines but does not break out at all. As mentioned before, share volume rising quickly is a good estimate of the breakout point approaching.
Descending Triangle Pattern
A descending triangle is a bearish candlestick pattern – meaning it foretells the occurrence of a period when the price of a particular security is expected to move downwards. It appears when through two lines – one joining a series of lower highs a second horizontal trend line that connects a series of lows.
It is also sometimes referred to as the right-angle triangle due to its shape. The descending triangle chart pattern is an indicator that sell-side traders are getting aggressive and will take control of the price momentum of the security.
Generally, traders wait till there’s a breakdown in the lower support trend and then take short positions, eventually pushing the price of the security lower.
This candlestick pattern is quite popular with traders as it indicates that the demand for a security is weakening in the capital markets. The descending triangle gives a trader the chance to make substantial gains in a short period of time.
Anatomy of a descending triangle pattern:
- There should be a downward shift in the price momentum of the security before the descending triangle. It's important to note that investors shouldn’t pull out or pour money whenever the pattern appears.
- It appears when the price of the security is neither continuing nor reversing a larger price trend i.e. when the market is in a consolidation phase with regards to an asset
- The flat lower trend line in the descending triangle chart pattern should be formed with at least two intermittent lows — while it’s not necessary that they need to be precisely the same, they should be reasonably close to each other. There should be a gap with respect to the time difference when they appear during the trading period.
- There should be at least two intermittent highs in between the lows to form the descending upper trendline. This feature of the descending triangle signifies that the market is in a consolidation phase where traders will go bearish on the price of the asset. The highs should get successively lower to achieve the descending trendline
- This is when there’s a breakdown in the descending triangle. At this point investors look for a continuation of the downtrend which will in turn confirm the descending triangle.
- It should not be confused with the ascending triangle which has has a horizontal trend line connecting the highs and an ascending trend line joining the lows
Investors generally wait for the breakdown point before taking a short position in the asset after the descending triangle chart pattern is confirmed. There is a simple measuring technique to gauge a price target so as to make gains. Usually, it is calculated by subtracting the distance between the upper and lower trend lines at the point of breakdown from the entry price.
Failure Of Triangle Continuation Pattern
In 80 percent of cases, triangles are continuation patterns, and breakouts happen in the prevailing trend’s direction. But there are also exceptions, called triangle failures, where a triangle pattern denotes a trend reversal. It occurs when the breakout occurs in the opposite direction of the existing trend. In such cases, traders must wait for breakout confirmation and alter their positions in the direction of the trend.
Key Points To Remember In Triangle Continuation Pattern
- Always be mindful of the direction of the trend before the triangle pattern occurs
- Triangle failure is a trend reversal pattern, often accompanied by a top pattern like head and shoulder, Morning Star, or Evening Star before the reversal
- If you are a new trader, don’t take a position unless you receive a confirmation on the direction of the breakout
The bottom line
Triangle continuation patterns are commonplace and appear in any timeframe for any asset chart. Studying triangle patterns help you identify where a trade lies. In most cases, traders will trade in the direction of the prevailing trend as the triangles are pretty convincing continuation patterns. But there are also times when the price actually breaks out in the opposite direction. With time and experience, you’ll gradually learn to predict market momentum using triangle continuation patterns.
