Hey trader,
How helpful would it be to have a dossier of the stocks you are following?
How convenient is it to get a reminder when the stock hits a specific price or volume you have in mind?
Sure thing, right.
Angel One lets you explore more about a scrip in its Stock Overview section. This article will walk you through the Stock Overview window of the Angel One mobile application that will help you learn more about the specific stock.
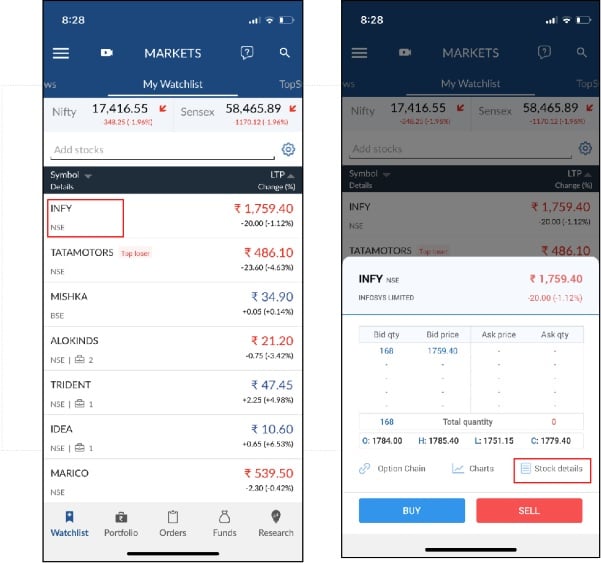
How to reach Stock Overview?
- Click on the scrip you want to know the details about
- Go to ‘stock details’
Disclaimer: Such representations are not indicative of future returns.
Stock Overview window gives the following analyses of the stock:
- Overview
- Technical
- Derivatives
- Fundamental
You can also access Option Chain (only for the stocks available) and Charts of the scrips you view.
Let us see what each section covers.
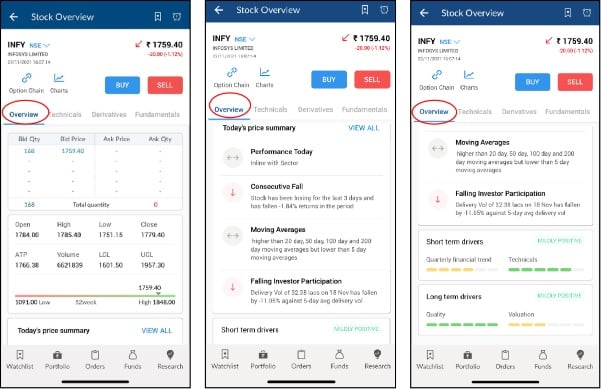
Overview
The Overview section contains the following information about the stock.
- The ongoing ‘bid’ and ‘ask’ prices of the stock and the respective quantities
- Open Price (Open), Highest price (High), Lowest price (Low), Close price (Close) of the stock on that trading day
- Average Traded Price (ATP), the volume traded, Lower Circuit Limit (LCL), Upper Circuit Limit (UCL) of the stock for that trading day
- - The 52-week low and high prices of the stock and the Last Traded Price( LTP) of the scrip
- - Performance of the stock on that trading day with the following details
Performance Today
- Consecutive Fall
- Moving Averages
- Falling Investor Participation
- Liquidity
The aspect of short term driving trend based on the following scales
- Quarterly financial trend
- Technicals
The aspect of long term driving trend based on the following scales
- Quality
- Valuation
[ On the scale, Red denotes negative, yellow represents mildly positive, and green indicates Positive]
Disclaimer: Such representations are not indicative of future returns.
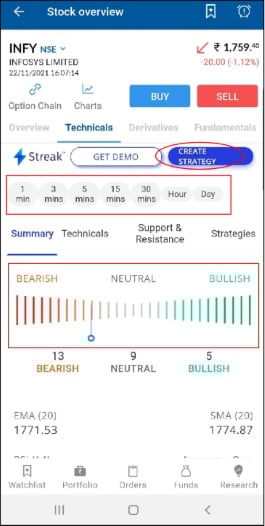
1. Technicals
We source technical details of stock from Streak, an external technical partner of Angel One.
A beginner can find the ongoing trend of the stock( bearish/ neutral/ bullish) for different time scales( 1 min/3 mins/5 mins/15 mins/30 mins/hour/day)
Further, one can create a strategy to invest in the stock logging into Streak.
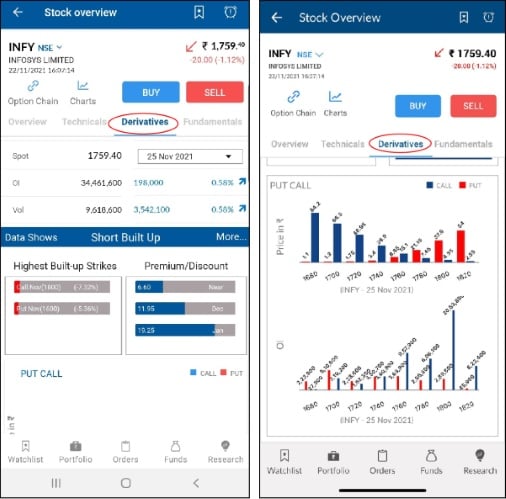
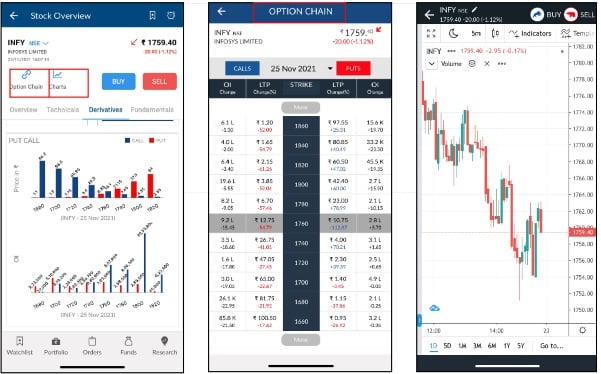
2. Derivatives
The derivative section covers information about the future & options contract of the stock.
It includes the chart, highest built-up strikes, premium/discount, Open interest (OI), volume, and Spot price for the various expiry dates.
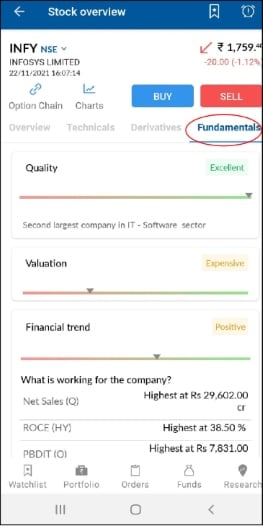
3. Fundamentals
The fundamental analysis covers the characteristics of the stock like
- Quality
- Valuation
- Financial Trend
Apart from the above sections, you can also view the Option Chain ( if available for the stock) and Chart of the stock.
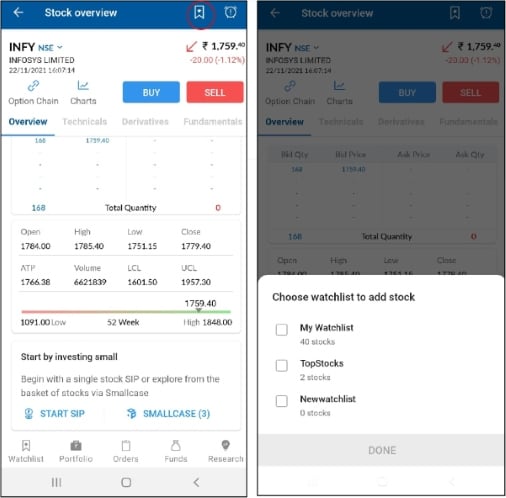
If you choose to add the scrip to any of your watchlists,
- Click on the Watchlist icon
- Select the watchlist where you want to add the scrip
- Press ‘Done’
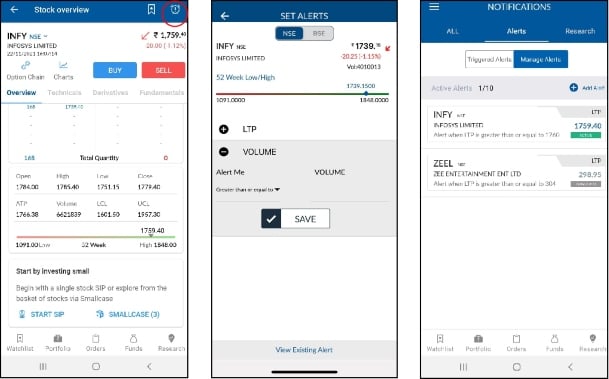
If you want to buy/sell the scrip at a specific price or volume, set an alert by clicking on the ‘clock’ icon on the top right. You can view your existing alerts as well and make changes to them.
Now that you are aware of all you can know about a stock in a few clicks, make the most of it.
Happy Trading!!
Online share trading has transformed the way Indians invest in the stock market. With just a smartphone or laptop, you can buy and sell shares from anywhere, anytime — without paperwork or visits to a broker's office. Angel One's online trading platform gives you instant access to NSE, BSE, MCX, and NCDEX, advanced charting tools, real-time price feeds, and ARQ Prime AI-powered investment recommendations. Whether you want to invest for the long term or trade actively, online share trading puts the power of the markets directly in your hands.
