

Nifty Pharma Gains for Fifth Session, Hits All-Time High


The NSE benchmark Nifty50 index is having a blistering start to the August series, with the index gaining 200 points and trading at the 24,600 mark, up by 0.78%. Interestingly, all sectors are contributing to this rally, but one sector, in particular, has caught everyone’s attention: Nifty Pharma.
Nifty Pharma’s Impressive Performance
Nifty Pharma has surged by 1.45%, marking a fresh all-time high. This index has extended its northward journey for the fifth straight day on Friday. In July alone, it gained 8.7%, making it the best-performing month since November 2024. Over the year, the index has advanced by an impressive 27.35%.
Broad-Based Gains in Nifty Pharma
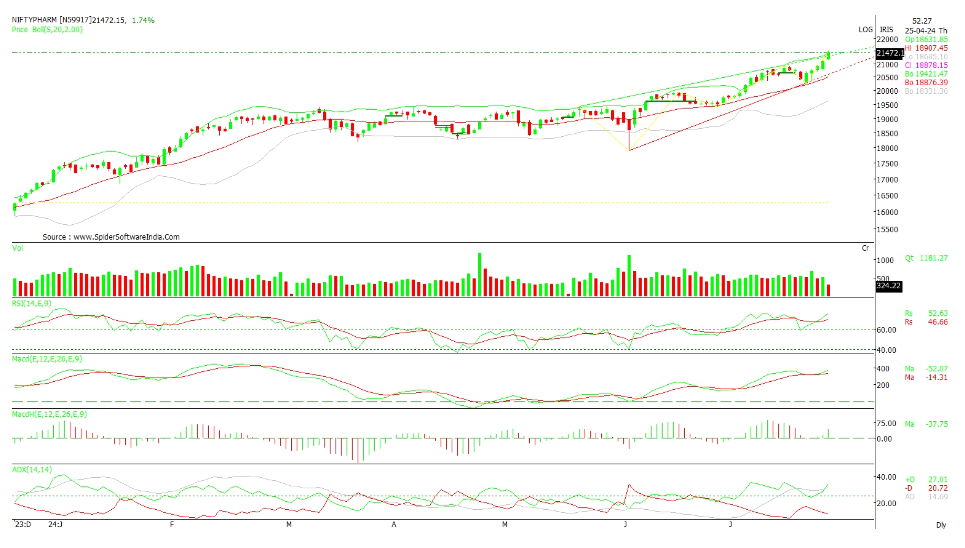
All the constituents of the Nifty Pharma index were trading in positive territory on Friday. Technically, the index is trading above all its key moving averages, which are trending higher, indicating strong market sentiment.
Breaking the Rising Wedge Pattern
In a surprising turn of events, the Nifty Pharma index has breached the upper boundary of the rising wedge pattern, defying conventional bearish expectations. Traditionally, the rising wedge is considered a bearish pattern, signaling a potential reversal when the price breaks below the lower trendline. However, the current market dynamics have shown robust bullish momentum, leading to an upward breakout.
Continuation of Bullish Trend
This breach above the rising wedge’s upper boundary suggests that buying pressure is strong enough to overcome the typical bearish sentiment associated with this pattern. It indicates a continuation of the bullish trend rather than a reversal. Such movements are rare and can signal significant underlying strength in the index.
Technical Indicators Confirm Positive Bias
The daily MACD is pointing northward while sustaining above its nine-period average, thus validating a positive bias in the stock. The trend strength is extremely high, with the Average Directional Index (ADX) as high as 31.34 on a daily chart and 26.07 on a weekly chart. Generally, levels above 25 are considered indicative of a strong trend, and in both time-frames, the stock is meeting the criteria.
Disclaimer: This blog has been written exclusively for educational purposes. The securities mentioned are only examples and not recommendations. It is based on several secondary sources on the internet and is subject to changes. Please consult an expert before making related decisions.
Published on: Jul 26, 2024, 8:31 PM IST

- Temasek Backs Singapore Airlines Long-Term Investment in Air India Amid Funding Questions
- SEBI Reviews SME IPO Rules, Proposes Bigger Institutional Role and Stricter Listing Norms
- Top Gainers and Losers on August 28, 2026: TCS, TechM and Infosys Rise Up to 4%
- RITES Share Price in Focus; Opens Branch Office in South Africa
- Top Gainers and Losers on August 27, 2026: Hindalco, HDFC Bank and Mahindra & Mahindra Fall Over 2%
Related Articles

Enjoy ₹0 Account Opening Charges
Get the link to download the App


