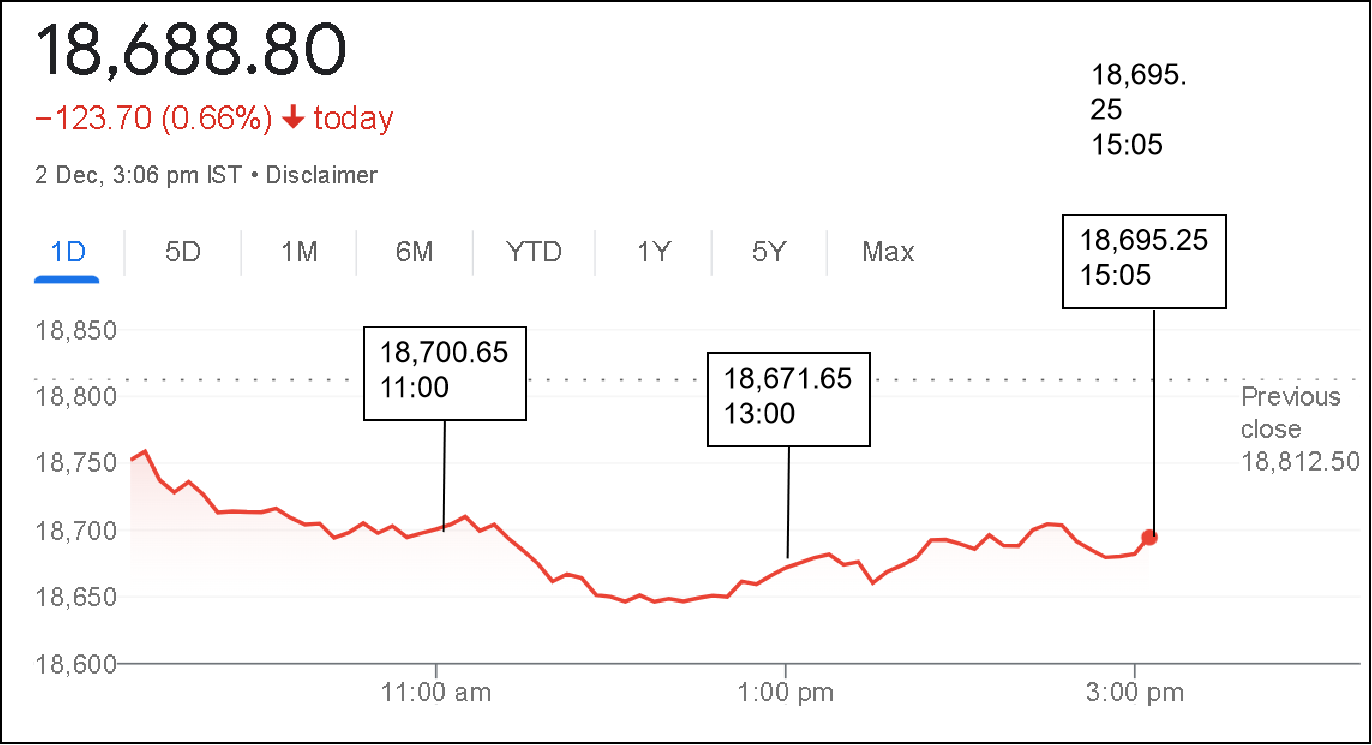

Amid conflicting weak global cues, the NSE Nifty opened at 18,752, a gap down by 60 from its closing value of 18,812 yesterday. The Nifty and Sensex overall gave up Thursday’s gains However, the Nifty Midcap and Nifty Smallcap indices are trading 0.1% higher despite the fact that the overall markets are largely down.
The sectoral indices of Nifty fluctuated between gains and losses. The top performers are Nifty Oil & Gas and Nifty Realty, while the biggest laggards are Nifty Auto and Nifty FMCG.
Let us see some of the following stocks to gauge what has happened:
| Stock Name | Current Market Price (in ₹) | Price Change | Market Cap
(in ₹ Cr) |
| One97 Communications | 524.10 | 4.67% | 32,526 |
| Nykaa – FSN E-commerce | 175.45 | 2.36% | 48,819 |
| Apollo Hospitals | 4878.65 | 2.16% | 68,667 |
| Stock Name | Current Market Price (in ₹) | Price Change | Market Cap
(in ₹ Cr) |
| Adani Transmission | 2,738.10 | -3.39% | 3,16,159 |
| Eicher Motors | 3,337.25 | -2.91% | 93,999 |
| Mahindra & Mahindra | 1,262 | -2.36% | 1,54,654 |
| Stock Name | Current Market Price (in ₹) | Price Change | Market Cap
(in ₹ Cr) |
| Oil & Natural Gas Corporation Ltd | 141.9 | 1.36% | 1,76,124 |
| Adani Ports and Special Economic Zone Ltd | 897.3 | 0.80% | 1,92,285 |
| Reliance Industries Ltd | 2,729 | 0.20% | 18,42,346 |
| Tech Mahindra Ltd | 1,103 | 0.08% | 1,07,261 |
| Hindalco Industries Ltd | 463.1 | -0.06% | 1,04,135 |
| Britannia Industries Ltd | 4,391 | -0.18% | 1,05,969 |
| Adani Enterprises Ltd | 3,907 | -0.20% | 4,46,299 |
| Kotak Mahindra Bank Ltd | 1,929 | -0.27% | 3,84,086 |
| Tata Motors Ltd | 437.0 | -0.30% | 1,45,572 |
Whenever the price of a particular stock, or any other asset for that matter, opens above or below the close of the previous day, assuming there was no trading in between those times, it is said to be “gapping” in the stock markets.
Stock market gaps are visible on a chart when a stock’s price jumps abruptly between two candlesticks, leaving a vertical gap in a chart.
Stocks that would open in the following trading session at a higher price than the closing price of the previous day are said to have experienced a “gap up”. This may happen for various reasons that cause the market (especially the major players in it) to be bullish enough to skip the prices that fall in the gap up and bid prices much above the closing price.
Similarly, if a stock opened at a price lower than the closing price from the previous trading session then it is said to have experienced a gap down. This shows that the sellers were desperate enough to charge a far lower price than the LTP of just the previous day.
All said, it’s crucial for traders to accurately recognise the gap type they’re dealing with and to hold off on placing a trade until a directional movement has formed.
Tracking indices and their underlying assets easily is a must for both equity and options traders as well as investors. Open demat account with Angel One today to experience our advanced user-oriented index tracking features and much more!
Published on: Dec 2, 2022, 1:50 PM IST
We're Live on WhatsApp! Join our channel for market insights & updates
