Purpose
The watchlist provides the users with all the data points they need to choose the securities for themselves. The information is presented in succinct manner for a seamless and focused user experience. SECTION WISE DESCRIPTION
Search bar
If you want to search new stocks, type in the name into the search bar. Selecting a stock from the results shown by the search bar will add that stock to your current watchlist. When you start typing the name of a particular scrip, you get 4 quick filters that allow you to narrow down your search quickly. The 4 filters that you get are:
- Cash
- F&O (Futures and Options)
- Commodity
- Currency
Furthermore, it is not necessary that you search with the name of the scrip only. For example, if you are looking for options, you can search with “CE” (Call option European) and “2000” and the search bar will show you all the call European options with ₹2000/- as the strike price. Therefore, once you enter a data, any corresponding set of scrips with that data as a part of their description will appear in the search bar. 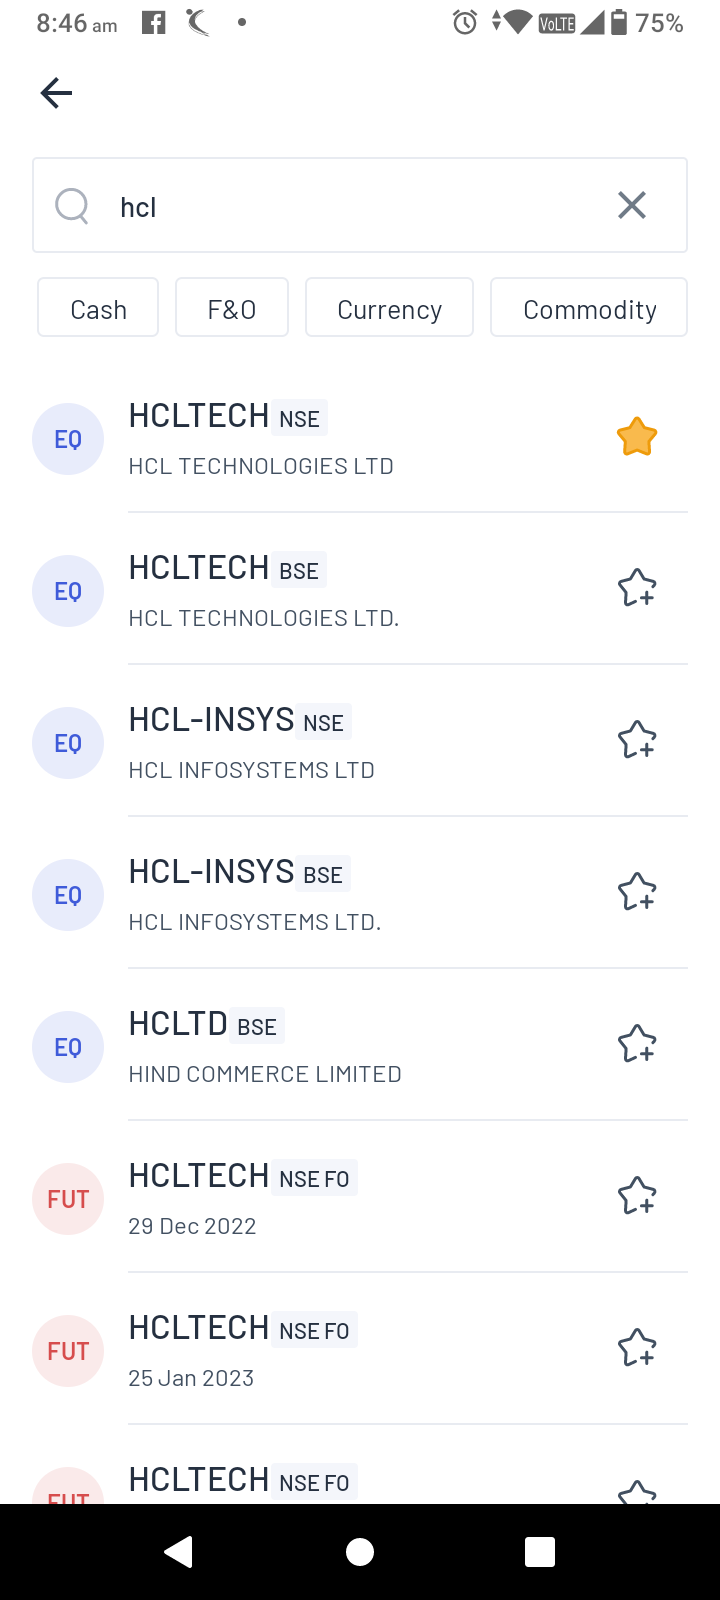
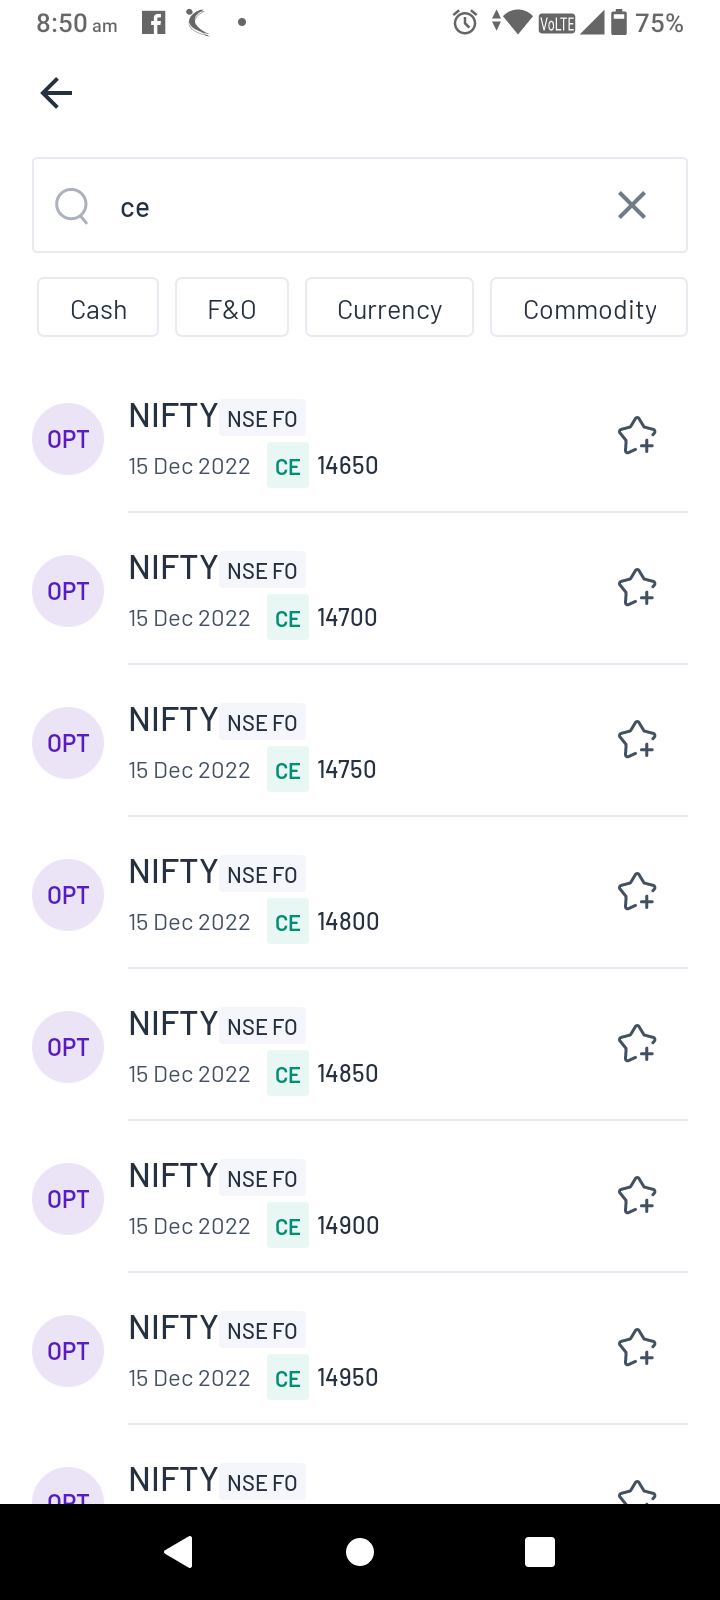 Figure: Basic search for a stock (left) and searching call european options (right)
Watchlist
Once a watchlist is created, you now have a list of chosen assets that you want to work with. Each stock on the list will show the following information:
- Asset name (both full name and codename)
- Exchange name
- Current market price
- Change in price since the closing of trading hours the previous day (both absolute change and percentage change)
In addition to the above, the current market price and daily price change (both in absolute and percentage terms) of two major indices of your choice is shown on two main cards on the Watchlist. The indices that can be added here are currently Nifty 50, Nifty Bank, Nifty Financial Services and Sensex, though more indices may be added to this list soon. Clicking on these above cards will open their charts with the latest expiry. In case you own any of the assets being shown on the watchlist, you will also see the quantity or the number of units of the assets that you own right beside its name. This facility is, however, available only for the assets whose delivery has been taken by you (i.e. not intraday). 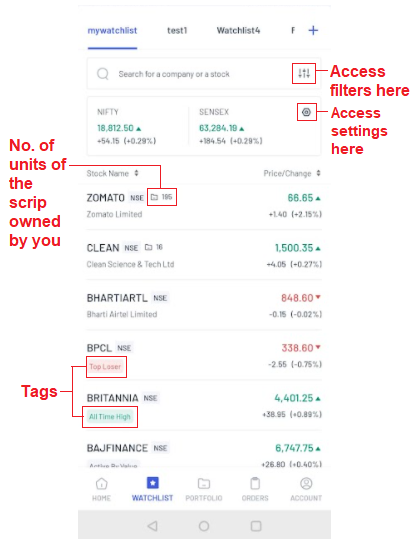 Figure: Sections of the watchlist you might have missed - number of units of the scrips owned by you, Settings and Filters
Options Watchlist
On top, right beside the Watchlist, there is also a separate Watchlist exclusively for options. Here you can see the list of option contracts that are open on the market. On the top, you have two main cards where you can see the performance of two indices of your choice, out of NIFTY, BANKNIFTY and FINNIFTY. You can choose your preferred two indices on the main cards by clicking the down arrow on the right and then checking the boxes next to your preferred two indices. Clicking on the card, you can quickly view the option chain of that index with the latest expiry. The screen will show a list of seven option contracts with the tags ITM, ATM or OTM i.e. in the money, at the money, out of the money respectively. The seven contracts will consist of one ITM, one ATM and five OTM contracts in descending order. For better visibility of key options, ITM, OTM and ATM contracts will have different colored tags and ATM contract backgrounds will be highlighted. All the strike prices will be shown in ascending order for call options and in descending order for put options. 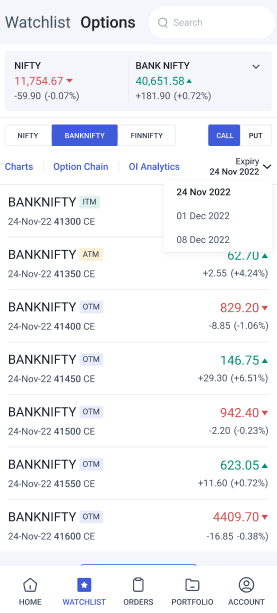 Each option on the list will show the following details:
- The name of the asset e.g. Banknifty
- The name of the exchange
- The expiry date
- The strike price
- The asset class e.g. call european or put european.
- The current market price of the option
- The change in the market price of the option since the beginning of trading hours on that day (both in absolute and percentage terms)
Right below the two main cards on the Watchlist, you can see the options to filter the list of open option contracts. You can filter this list easily in terms of -
- The index i.e. Nifty, Nifty Bank or Nifty Financial Services
- Option type i.e. Call or Put
- Expiry Date of the Option - you can change the expiry date by clicking on the down arrow next to the date. Upon clicking, the six nearest expiry dates will be shown, out of which you can choose your preferred one.
On the iOS version, you can also sort your option contracts in the Watchlist based on:
- Expiry Date
- Strike price and
- Option type i.e. CE/PE
You can expand this list of option contracts on your screen by clicking on ‘Show More’. 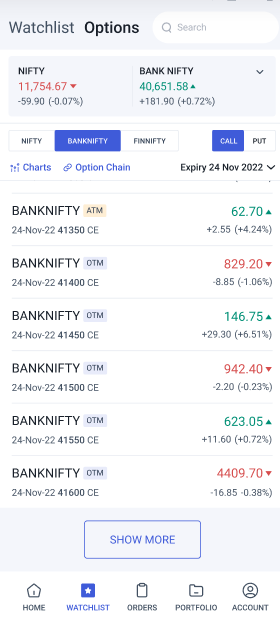 Figure: Options Watchlist along with filters If the ATM contract goes out of the screen while scrolling up or down, there will be a floating button saying ‘Re-Center’ at the bottom. Clicking on ‘Re-Center’ will bring back the screen with the ATM contract at the center. You can use the back button of your phone or the one at the top of your screen to return to the list with seven contracts only. Clicking on any contract will open a short overview. From here, you can directly go to the Option Chain or the Chart for that particular index.
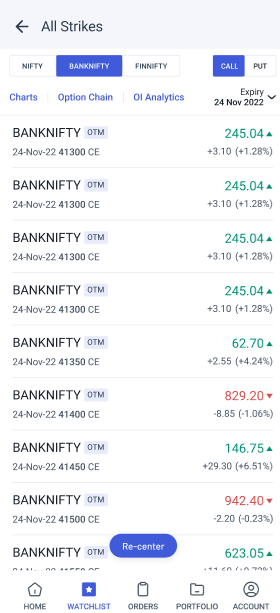
Filter
If you click on the filter sign (represented by 3 rods/hamburger button) right next to the search bar on the watchlist, then you will get to a settings page for the watchlist (not the app in general). In this page, you can -
- Choose to unsee tags
- Filter what you see based on the following 4 filters -
- Type of asset -e.g. Equity, F&O, Commodity and Currency
- Exchanges - BSE, NSE, MCX
- Tags - as per the list mentioned of tags
- Portfolio - narrow down to the portfolio you want to view (in case you have more than one)
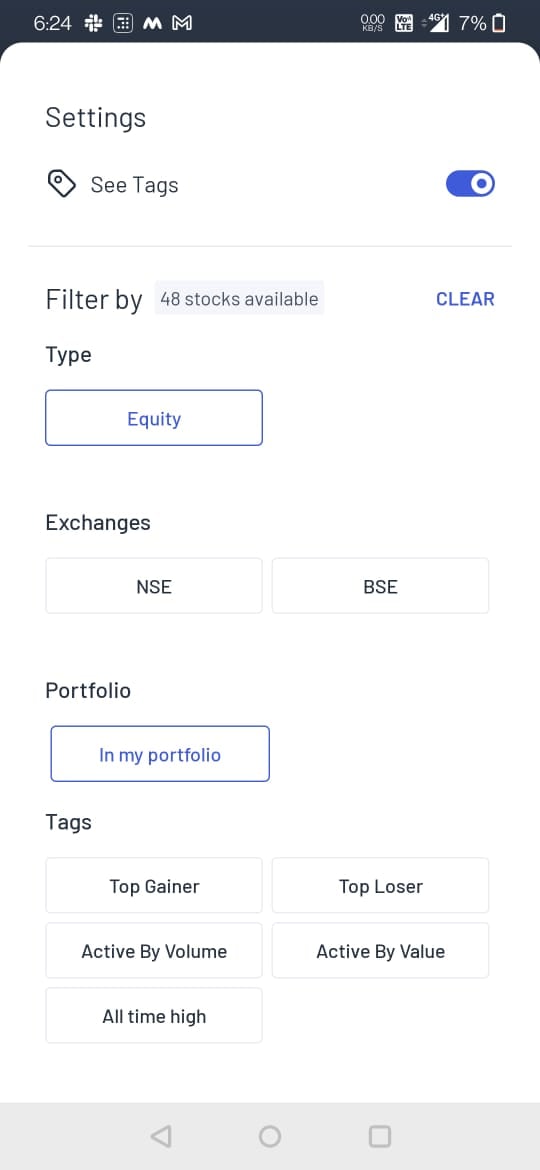 Figure: Filter section The contracts listed under the Option Watchlist can be filtered based on:
- The index – NIFTY, BANKNIFTY or FINNIFTY (for now)
- The option type i.e. call or put
- The expiry date
Tags on the watchlist
Angel One has also come up with the additional feature of Tags on the watchlist. For example, if a stock has been gaining in price by a high percentage amount, then a tag of “Top gainer” is given beneath its name. If you click on the stock and then click on the tag, then you will be taken to a list of stocks with that tag (“Top gainers” in this case). You can add stocks from this section directly to your watchlist. There are five main tags that are applied to any asset -
- Top gainers - Assets with the highest gains (in %) over their last closing price.
- Top losers - Assets with the most losses (in %) since their last closing price.
- Active by volume - Assets with the highest level of trading activity by volume today.
- Active by value - Assets with the highest level of trading activity by value today.
- 52 Week high - Assets whose prices are at their 52 Week high
- 52 Week low - Assets whose prices are at their 52 Week low
- All time high - Assets whose prices are at their all time high
- All time low - Assets whose prices are at their all time low
- Events (Corporate Actions) - Stocks of companies with a major upcoming event - specifically, Stock Split and Bonus shares declaration.
In case there is an event-based tag on the stock, then when you click on the stock and see the overview, then beneath the options of chart or market etc. you will see the event details written, right next to a blue and white star sign. The expected date of the event and the ratio involved will also be mentioned.
How to manage watchlists?
In the case of Android, if you tap and hold any watchlist - it will show you options to edit, delete or reorder the watchlist (reordering means rearrangement of the watchlists by holding and moving them). In the case of iOS, you will have to click on the kebab menu (represented by 3 vertical dots) and the above options of edit, delete and reorder will appear. You can add new watchlists as well as remove them whenever you want. For example, you may choose to have different watchlists for different sectors or for other categories such as penny stocks. You can add a new watchlist by clicking on the “+” sign to the right of the watchlists - clicking it will open a window asking you for the name of the new watchlist. Once the watchlist is created, you can add new stocks by clicking “Add Stock” and searching for stocks to add from the search bar.Once the stock you are looking for appears on the search bar, you have to click on the star+ sign in order to add it to the watchlist. The list does not have to include stocks (i.e. “cash” segment) only - it may also include F&O (Futures and Options), Currency, Commodity, and Indices. If a sector or asset class becomes uninteresting, you may remove them or even the entire watchlist to keep your workspace neat and simple. 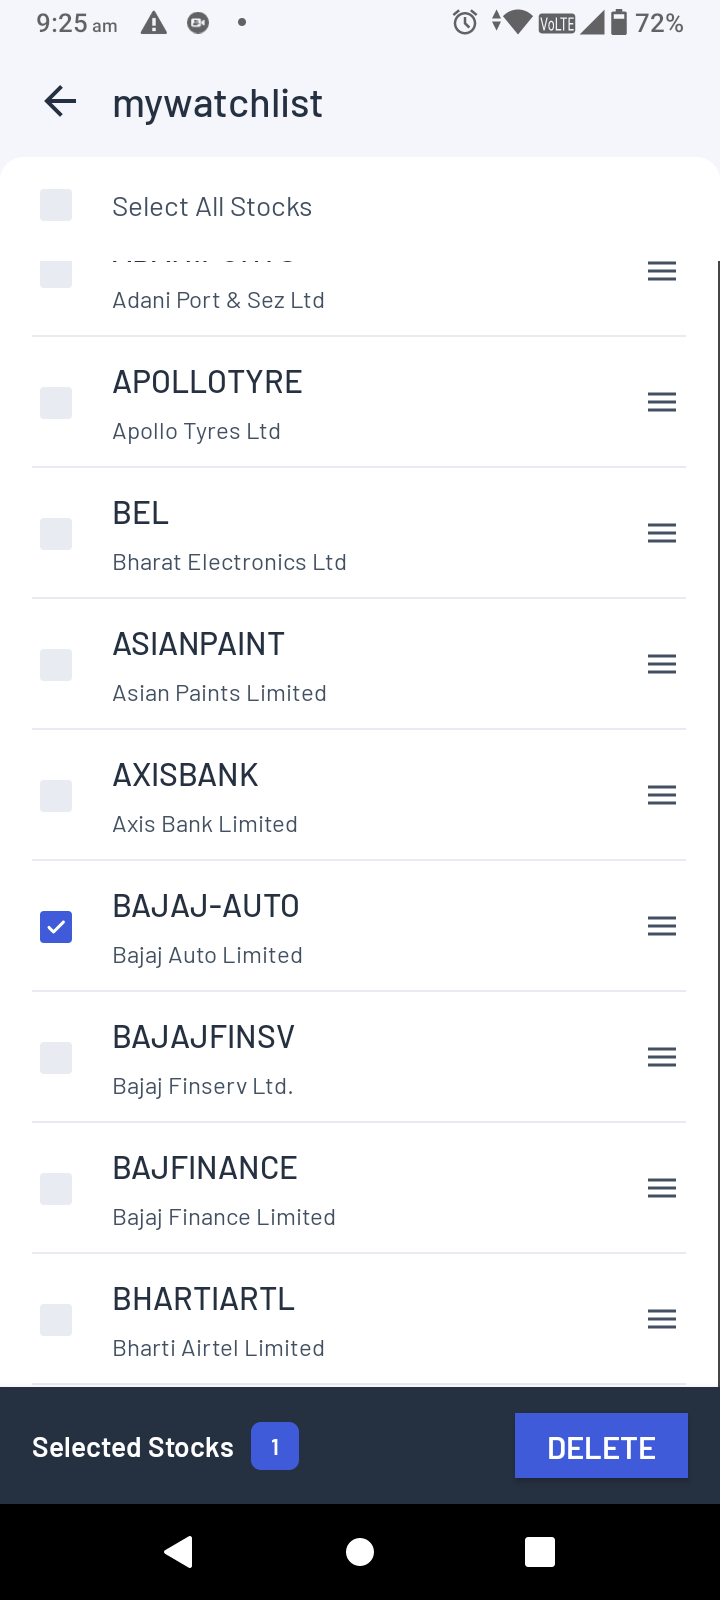 Figure: Deleting scrips from watchlist If you want to delete an asset from the watchlist, you have to first tap and hold on any of the assets on the list - it will lead you to a checklist where you can click (or check) the asset(s) you want to remove and delete them.
Options
On top, right beside the Watchlist, you can also find the Options section. Clicking it will give you the list of the most active options for the near month maturity date. Each option on the list will show the following details:
- The name of the asset e.g. Banknifty
- The name of the exchange
- The expiry date
- The strike price
- The asset class e.g. call european or put european.
- The current market price of the option
- The change in the market price of the option since the beginning of trading hours on that day (both in absolute and percentage terms)
Settings
You can access the settings on this page from two different places:
- Beside the search bar
- Beside the Sensex box
Now that we know the basics of the watchlist, let us see what happens when we choose one of the stocks/assets in order to know more about its fundamentals and technicals.
Charts
When you click a stock (suppose the stock is named XXX Ltd.) then you will be initially shown three sections that are a part of the “Overview” of the stock- charts, markets and option chain. Initially these will be shown to you in an abridged format. Hereafter, in order to access the enlarged data, tap on the screen and scroll upwards. The entire stock data will emerge with the following sections.
- Overview
- Technical
- Derivatives
- Fundamental
Before investing in stocks, you should read up adequately about fundamental analysis and technical analysis, so that you can better understand the various data points mentioned in the following sections as well as comprehend the various reports that Angel One regularly releases regularly.
Overview
The overview section consists of the following sub-sections -
- Charts
- Markets
- Option Chain
Charts
This subsection shows the price action of the selected asset - on the x-axis there is the time period and on the y-axis is the price. The page also shows the daily opening and closing prices as well as the daily high and low. 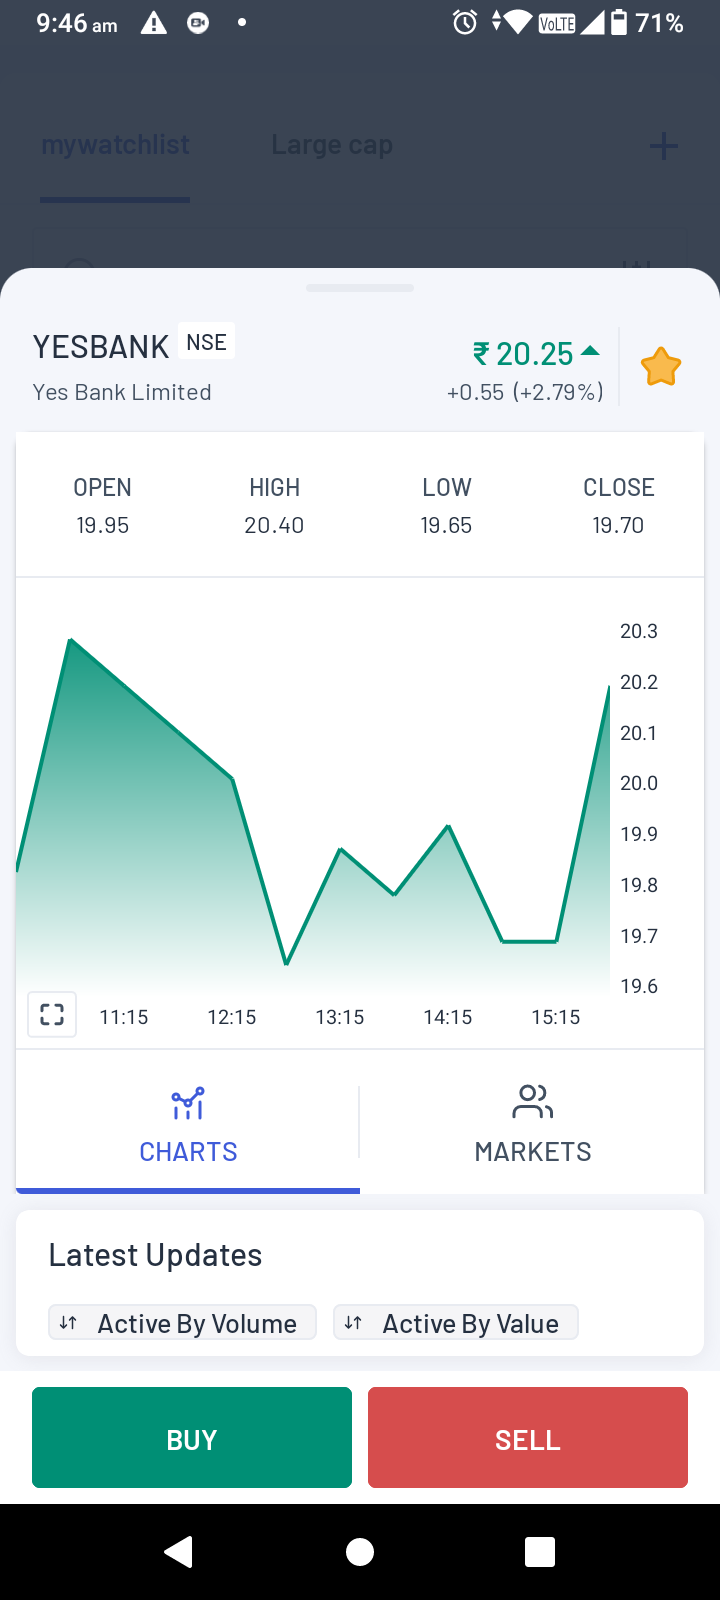
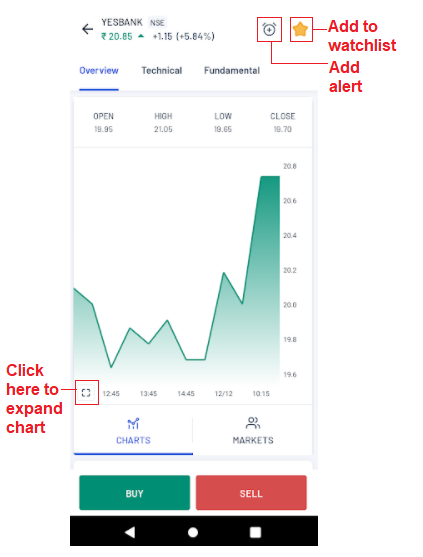 Figure: Section on individual scrips e.g. Yesbank stock in the above figure On the top right, there will be an ‘alert’ icon - clicking it will lead to a section where you can set an alarm for a particular security based on either price or volume or both. Therefore, if you do not have the time to track a stock, you can simply set an alarm for price and/or volume and the app will notify you when the security breaches that price or volume level. Furthermore, you can place the alert based on either absolute numbers (e.g. if a stock price goes above ₹120) or in percentage terms (e.g. if the stock price goes 10% above the price at which the alert was created). In the latter case, you simply have to put in the percentage and direction of change and the app will calculate the price or volume by itself. Clicking on the enlargement icon towards the bottom left of the chart or on any place on the chart takes you to the more detailed chart. Here you can see the following -
- Buy and Sell buttons - To the right of the asset name are the buy button (B) and sell button (S)
- The price movement - you may choose to change the chart type to line, area, bars, baseline, hollow candles, heikin ashi and candles or candlestick.
- The time frame -You can change the time frame (from 1 minutes right up to 1 month). Each candle will then represent one time period.
- The date range - With this, you can extend the time range from 1 day (1D) to up to 5 years (5Y). If you wish to further customise your chart, you can also choose the exact dates and time (right up to an exact minute) for the chart.
- Log and auto - You can adjust the scale of prices at which the chart is viewed by this feature
- Light and dark mode - You can choose the background to be dark mode or light mode by choosing the moon/sun icon on the top.
- Indicators - You can apply a whole range of indicators by clicking the icon “fx” which will lead you to a search bar for indicators along with suggestions. By clicking the icon next to it, you may save the indicator template that can be used again without hassle.
- To its right are the undo and redo buttons.
- To its right is the settings icon - can change candles colour, body, border etc.
- To the bottom of the detailed chart the buttons “Option chain” and “Orders” allows the user to directly access the option chain on the asset and the user’s positions (under the Order section) respectively.
- Copy chart image - By clicking this option, you can easily take a snap of the chart and send it to anyone you want to via social media e.g. Whatsapp.
- Bottom right corner sun - This feature allows to modify the price scale
If you click and move two fingers outwards, then you can zoom into the chart - i.e. reduce the time gap from months to days to minutes to be precise. 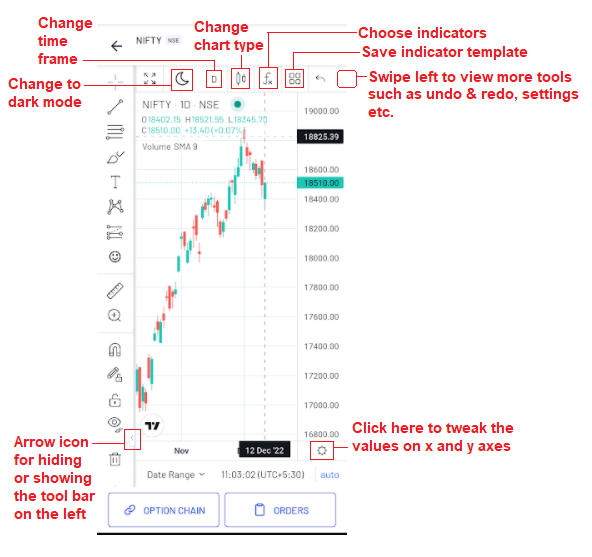 Figure: Expanded view of the chart On pressing the chart and holding, the open, high, low and close prices (OHLC prices) can be seen for each security. To disable the OHLC figures, simply tap on the screen once. On the bottom left, you will notice a small right arrow icon. It is extremely important as clicking it will bring out an assortment of lines, indicators, icons and side notes that can be applied/drawn on the chart for better understanding e.g. fibonacci retracements. Once applied, the indicator bar can be closed by clicking the same icon (now a left arrow). If the Angel One chart is getting too cluttered, you can also switch to the Trading View chart directly by clicking on the Trading View icon near the indicator arrow icon. Coming back to the abridged chart, if you scroll down, you will find the following links -
- Know your stock - This section will lead you directly to the ‘Fundamental’ section for the stock.
- Price summary - This section will give you important information on the stock’s price action on that day as well the last few days. For example, the volatility, latest gains or losses, various moving averages, volumes and expected liquidity will be mentioned .
- News - The latest news related to this company will be included in this section.
- Similar stocks - This section will show you companies whose products are similar to or related to the products of the company which you are analysing.
- Security info - This section gives some basic details about the stock/asset/derivative such as -
- Series
- Lot size
- Tick size
- Face value
- Freeze
- Volume
- Maximum order size etc.
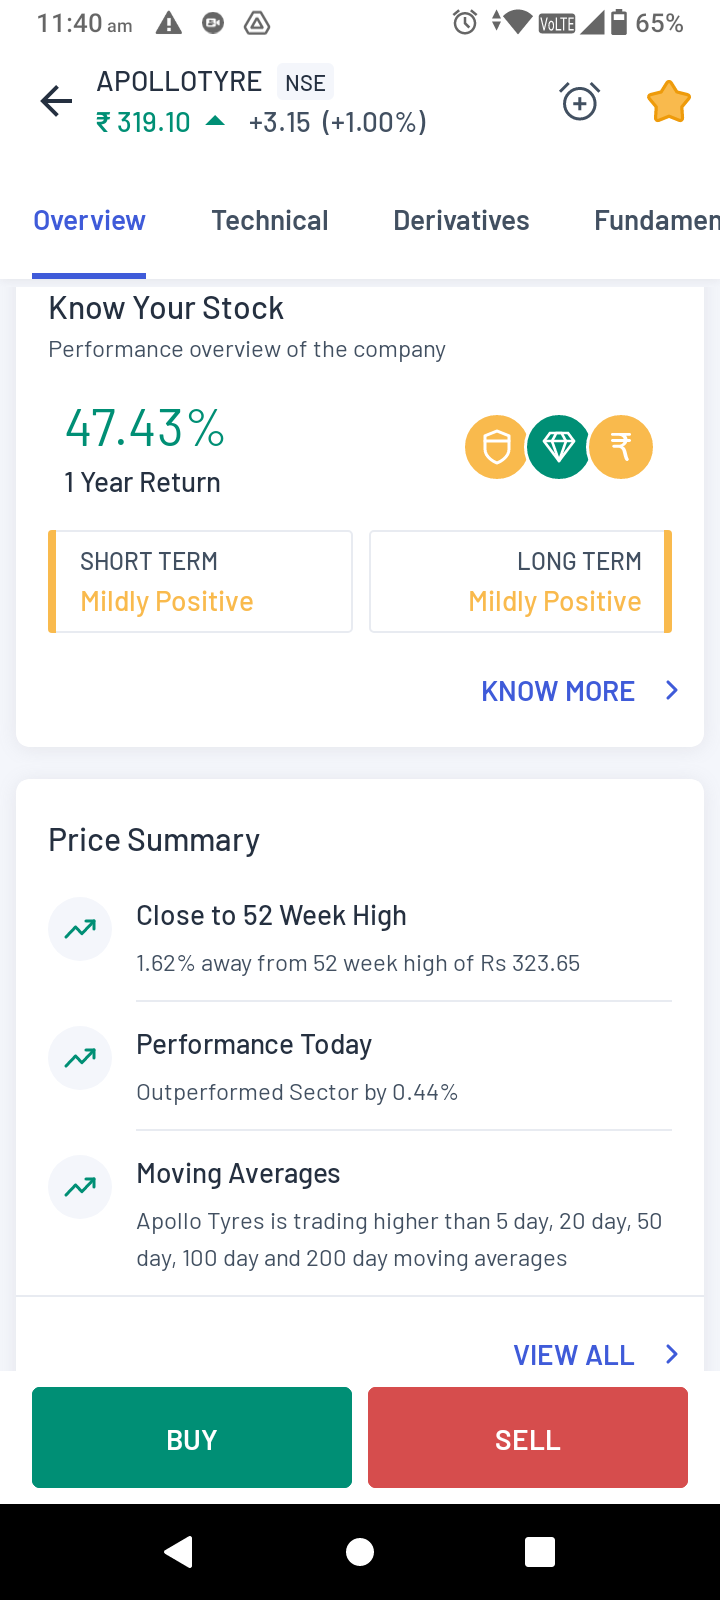
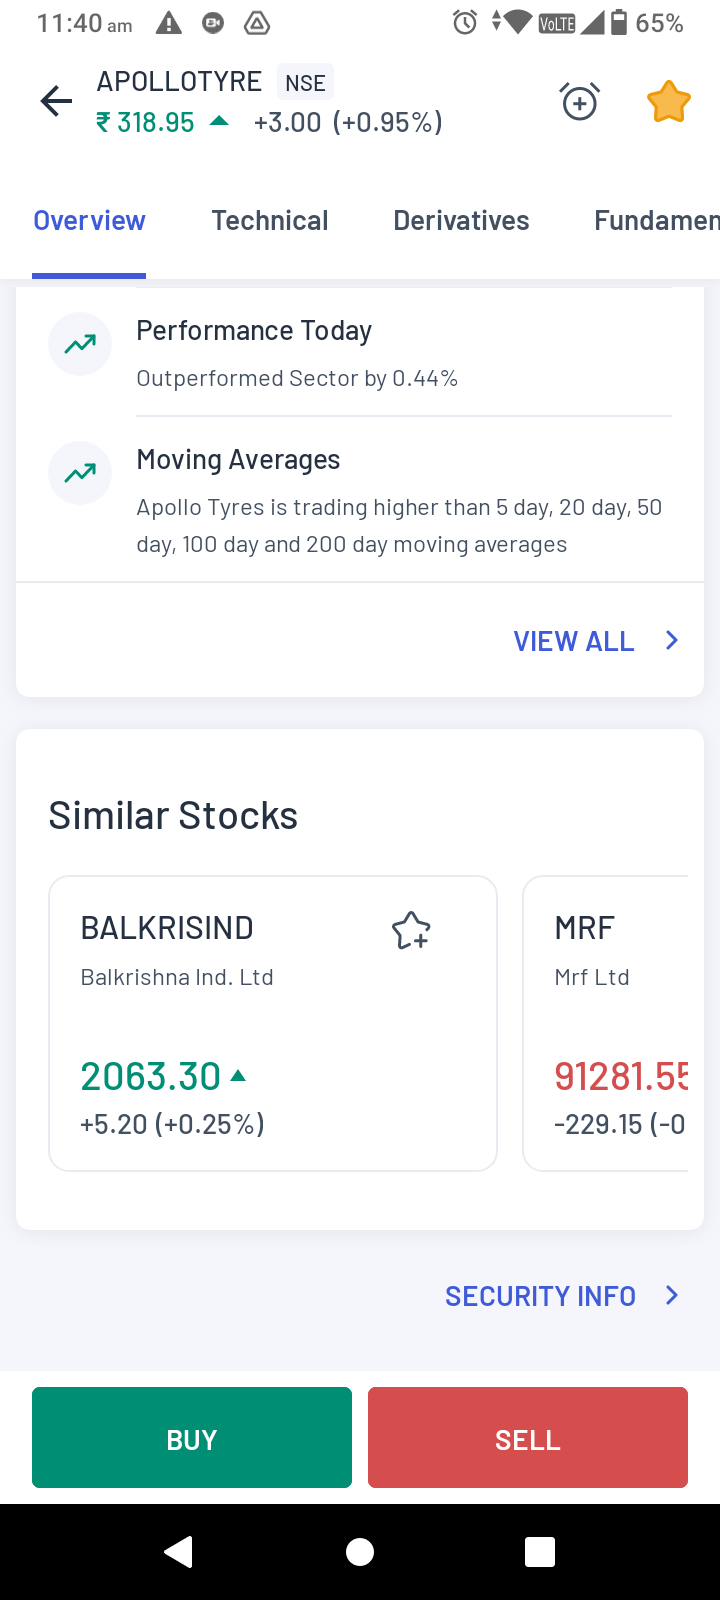 Figure: Know your stock and Price Summary (left) and Similar Stocks and Security Info link (right) MTM (Mark-to-Market) is now displayed on the Chart and Option Chain of an asset for better portfolio tracking. This figure considers all your derivatives open on that asset. For example, if you are on Nifty 50 Charts then the MTM shown would be the combined figure of all Nifty 50 Futures and Options contracts in your Position book.
Technical
This section is meant to give users a summary of important technicals of an asset - the detailed technicals are already available in the charts. The section includes the exciting features of strategy examination through back-testing powered by Streak. There are 4 main sections here of technical analysis data points -
Summary
This subsection begins with a view taken on the asset by the app (Bearish, Neutral or Bullish) based on scores - scores for various time frames are given. This is followed by 6 indicators - 20 day EMA and SMA, 14 day RSI, Awesome Oscillator, MACD (12,26,9) and Commodity Channel Index (20).
Technicals
This subsection shows two categories of technical indicators - moving averages and oscillators. Both categories show values for time frames of 1, 3, 5, 10, 15, 30, 60 minutes or even a day. First, it starts with a view taken on the asset based on the moving average (along with an explanation which is available on clicking the icon “i”). Thereafter, EMA and SMA of 5, 10, 20, 30, 50, 100 and 200 days are shown. Furthermore, Ichimoku Base line (9, 26, 52, 26), Volume weighted MA and Hull MA are also displayed. To the left of each of these indicators, the inference from their value is also stated as B (Buy), S (Sell) or N (Neutral). The second category, that is oscillators, starts with a view on the stock price movement (along with an explanation which is available on clicking the icon “i”). This category consists of the following indicators -
- 14 day RSI
- Stochastics
- CCI (20)
- 14 day Average Directional Index
- Awesome Oscillator
- Momentum (10)
- MACD (12,26,9)
- Stochastic RSI Fast (3,3,14,14)
- Williams % Range (14)
- Ultimate Oscillator (7,14,28)
Resistance and Support
This subsection first shows how close the asset price is to a resistance or support based on a score. Estimates of three levels of support and three levels of resistance are then provided for the real time price.
Strategies
This subsection contains sample strategies for educational purposes, not recommendations. However, it does give the user a framework with which they can start assessing the potential of the assets under their consideration. The list includes time-frame based strategies with both bullish and bearish views and are accompanied by the option for backtesting.
Derivatives
The Derivatives section shows the derivatives-based feedback on the particular asset under consideration. The primary data points shown here are the following -
- Trends in the option chain - For example, the asset might be experiencing a long buildup in the first hour and a long unwinding in the following hour - this will be reflected by a chart in this section. The trend can be examined on an hourly, daily, weekly and monthly basis.
- Open interest and change in open interest - if you click on the “View all” option in this subsection, you can view the basis on which the trend was declared (the basis being a combination of fresh contracts, contracts exited and contracts traded).
- Highest built up strikes - This shows the strike prices with the highest build ups in terms of both price changes as well as total open interest. The data is available on the highest build up for call and put options. The put-call ratio for the particular asset is also given in this section. You can also directly access the option chain from this section.
- Find maximum profit and loss - This is a great tool for traders to check the investment required for a particular strike price. It also useful for checking the maximum profit and loss possible for trading a call/put option for a particular strike price. Alongside the profit and loss, this section also shows the premium, open interest, lot size and capital requirement. If they want, traders can directly trade the option at the chosen option from this here itself, based on the results provided by this tool.
Fundamental
The page starts with “Know your stock” that includes ratings of the asset in terms of quality, valuation, financial trends along with the asset’s one year return in comparison to that of the sector and the overall market. Clicking the ‘Know more’ button beneath this subsection shows the following details -
- Assessments of the management risk, company growth and capital structure.
- Important features of the company and the stock
- A valuation scorecard
- Percentage (%) change in stock price and earnings
- Financial trend, including what all factors are working well for the company
Thereafter, you can find the list of 10 important fundamental ratios of the stock which are the following:
- PE Ratio
- Price to Book Value Ratio
- EV to EBIT
- EV to EBITDA
- EV to Capital employed
- EV to Sale
- Net NPA to Book Value (in case of a financial institution)
- PEG Ratio
- Dividend Yield
- ROCE
- ROE
Below it, you can find the subsection on shareholding patterns of promoters, FIIs, Mutual Funds, Insurance companies, Non Institutions and other DIIs. The fundamental section is not available for commodities, currencies and F&O assets - it is available only for stocks in the cash segment.
How to buy assets
If you choose to buy an asset, click on the “Buy” option - it will take you to the page where you will have two options - Delivery and Intraday. However, before you reach this page, you will first receive a quick guide on the options available to you in terms of -
- Delivery - investing and holding by paying the full amount
- Margin - own shares by paying only a fraction of the actual price
- Intraday - similar to margin
For delivery, enter the quantity of assets (e.g. shares) you want to buy at the given market price. You can place a limit or a market order. If you want, you can also buy shares on margin i.e. pay only a fraction (say 33%) of the actual cost in order to gain profits from the asset resale. In this section, you can also place a GTT order or a Stop Loss order - if you want to confirm what the terms mean you can easily click on the ‘i’ logo to their right and see the explanation. You can decide whether the order validity will be in terms of day or IOC. IOC i.e. Immediate or Cancel Order means the order will be executed as soon as it is released into the market, failing which the order will be removed For intraday, you can also choose to avail other smart orders such as Cover order, Robo order or a Stop loss order. If you do not understand the terms then click on the ‘i’ logo to their right and the explanation will appear. Here too, you can decide whether the order validity will be in terms of day or IOC. Finally, at the bottom of either page, you can see how much margin is required to place the order and the available margin that you have. Once the order is confirmed, you are taken to the ‘Positions’ page (if market order) or the ‘Open Orders’ page (if limit order). If you ordered an asset directly from a chart or an option chain, then upon order placement, you get redirected to that same chart or option chain. Thereafter, the moment the trade is executed, you get a notification on your device saying that the transaction is complete. We will see how to place the aforementioned smart orders later in this handbook section.
Charges
Once you enter the quantity of the asset that you want to buy/sell, a tab saying “Charges” automatically appears beside the margin amount below. Clicking it will give the user the list of charges that will be made for that specific trade (for the quantity of assets specified). This feature is available for both limit and market orders.
Best 5 prices
Once you switch to a limit order and then enter the quantity of the asset that you want to buy/sell, another tab saying “Best 5” appears above the backspace button on the keypad. Clicking it will give the user the best 5 prices possible for that particular asset. Once you have decided on the order and have the required amount available in your account, click on “Place buy order” to execute the buying process.
Split order
In case of certain segments such as equity derivatives, the exchanges place upper limits on the total number of lots that can be bought in a single order. Split order is a facility which, therefore, automatically breaks down a large order into smaller orders in order to fit the upper limit on lot sizes set by exchanges. Earlier the orders had to be broken down manually by the traders but with split orders, the entire process now is automated and hence, much faster and easier for the traders. For example, suppose you are an options trader who wants to buy 50 lots of Nifty call options - but the upper limit of Nifty call options per order is 36 lots. Because of the split order facility, you can enter the number of lots ordered directly as 50 and the app will automatically split the amount into two separate orders of 36 and 14 lots - you can then execute both the orders in one go by clicking “Proceed with 2 orders”. Brokerage charges will too be separately charged for each of these two orders. On the top right hand corner, you can open a dropdown box in order to change your exchange or switch to a sell order. On the top left, you will see the current market price of the asset and the daily change in the same.
How to sell assets?
If you click the “Sell” option, here too you will find the two options of delivery and intraday. Like buy orders, here too you can place GTT and Stop loss for delivery and Cover order, Robo order and Stop Loss order for intraday. All other features are also very similar such as limit and market order, selling on margin, setting the validity period of orders etc.
How to place smart orders?
GTT Order
Good Till Triggered (GTT) orders allow users to place an order to be executed only if the stock price hits a particular mark. Under GTT order, you can place a trigger price on both sides of the LTP. GTT orders have a 1 year expiry date, hence it cannot be intraday. In order to place a GTT order (available only for delivery orders), go to the orderpad (i.e. by clicking on ‘Buy’ or ‘Sell’ as per your requirement) and turn on the switch next to the GTT order option. Apart from the quantity of the asset, it will ask you to enter 2 details -
- Trigger price - If the LTP hits this target price, then the order gets released to the exchange for execution.
- Limit price - A limit order to buy/sell an asset is executed at either the price given by the user (called the ‘limit price’) or a price better than the limit price (i.e. lower than the limit price for buy order, and higher than the limit price for sell order)
Once the details are entered, you can now place the order by clicking “Create GTT”. In the equity/cash segment, the asset can be bought on delivery or margin. In the derivatives segment it is executed as a carry-forward type order. Example of GTT order Suppose you are planning to buy a stock X at ₹ 90, while it is currently hovering at ₹ 100. Therefore, you can place the GTT order with -
- Trigger price at ₹ 90
- Limit price at ₹ 91
- Quantity you want to trade
Now that you have placed the order, the moment the stock X hits ₹ 90 or a lower price, a buy order will be placed, just like a market order. However, because of the limit order, the buy order will not be executed at a price higher (worse) than ₹ 91. In case of both buy and sell GTT orders, limit price should always be between trigger price and LTP. However, in case of buy order, limit price should be more than the trigger price and in case of sell order, limit price should be less than trigger price. Similarly, if you are planning to sell a stock Y at ₹ 110, while it is currently being traded at ₹ 100, then place the GTT order with -
- Trigger price at ₹ 110
- Limit Price at ₹ 109.
Now that you have placed the order, the moment the stock X hits ₹ 100 or higher with available buyers (plus you have the adequate quantity of the asset in your demat account), a sell order will be placed, just like a market order. Because a limit order is in place, the sell order will not be executed if the price goes below ₹ 109.
Stop Loss Order
Stop loss order is available for both delivery and intraday orders. In order to avail this feature, turn on the switch next to the text - it will ask you to enter the following details:
- Trigger Price
- Order type - i.e. Limit or market order
- If the order type is limit order, then you will also have to enter the limit price. If it is a market order then the price will be given as per the market.
Once these details are entered, you can now place the order. Stop loss orders allow you to limit the potential losses you may face in case the price moves opposite to your expectation. For example, suppose you have decided to buy a stock for ₹ 100 and are expecting its price to rise, but want to limit your losses in case the price falls. Therefore, along with a buy order, you can also place a stop-loss order for say ₹ 90. Thereafter, if the price now falls to ₹ 95 or less, the stock will be sold. In case you place a limit order at a lower price like ₹ 97 (instead of the market order at the market price of ₹ 100), then the buy order will be executed at ₹ 97 or lower. For more information on stop loss orders and trailing stop loss orders, click here. GTT and stop loss cannot be placed simultaneously for the same stock. However, for intraday orders, limit and stop-loss orders can be combined under cover orders and robo orders. 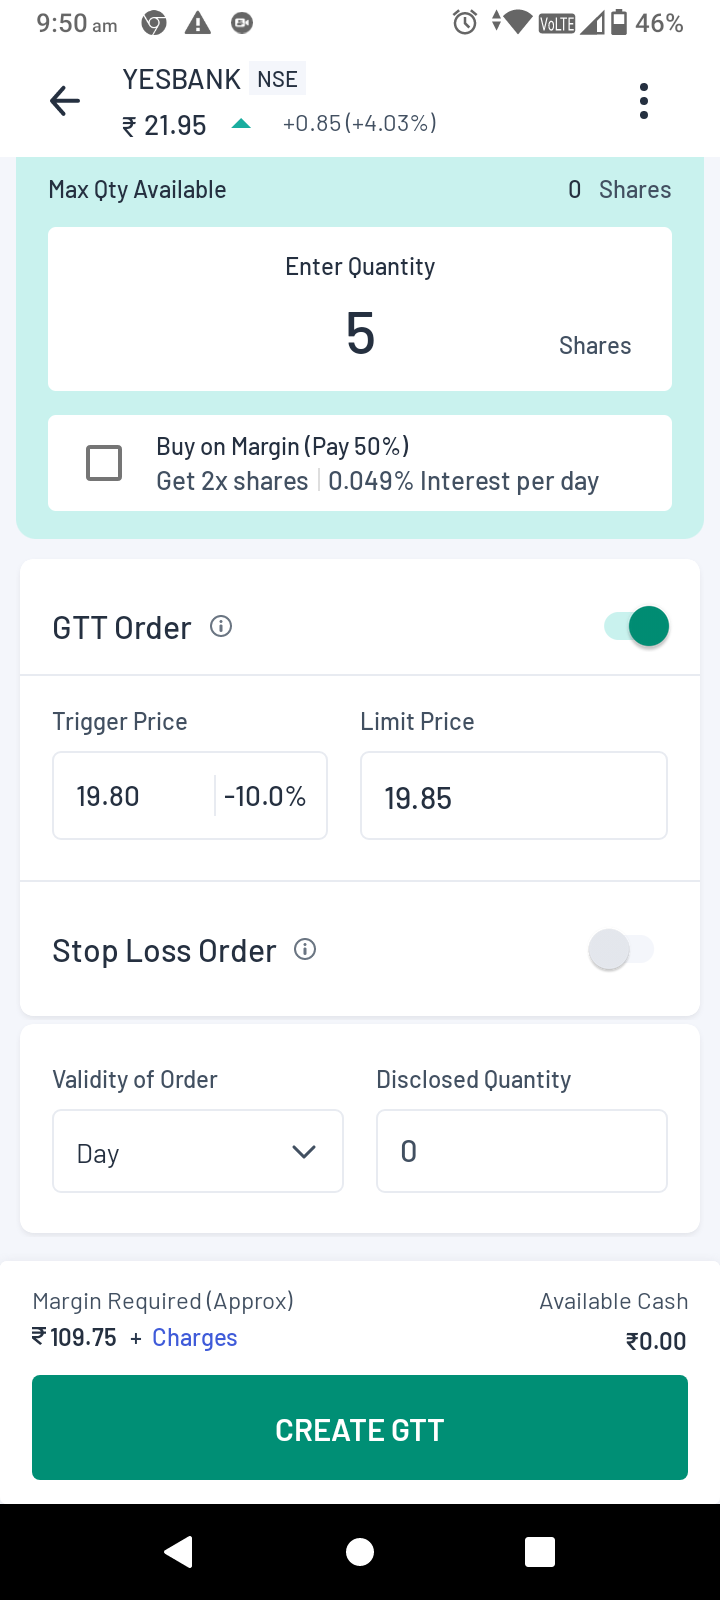
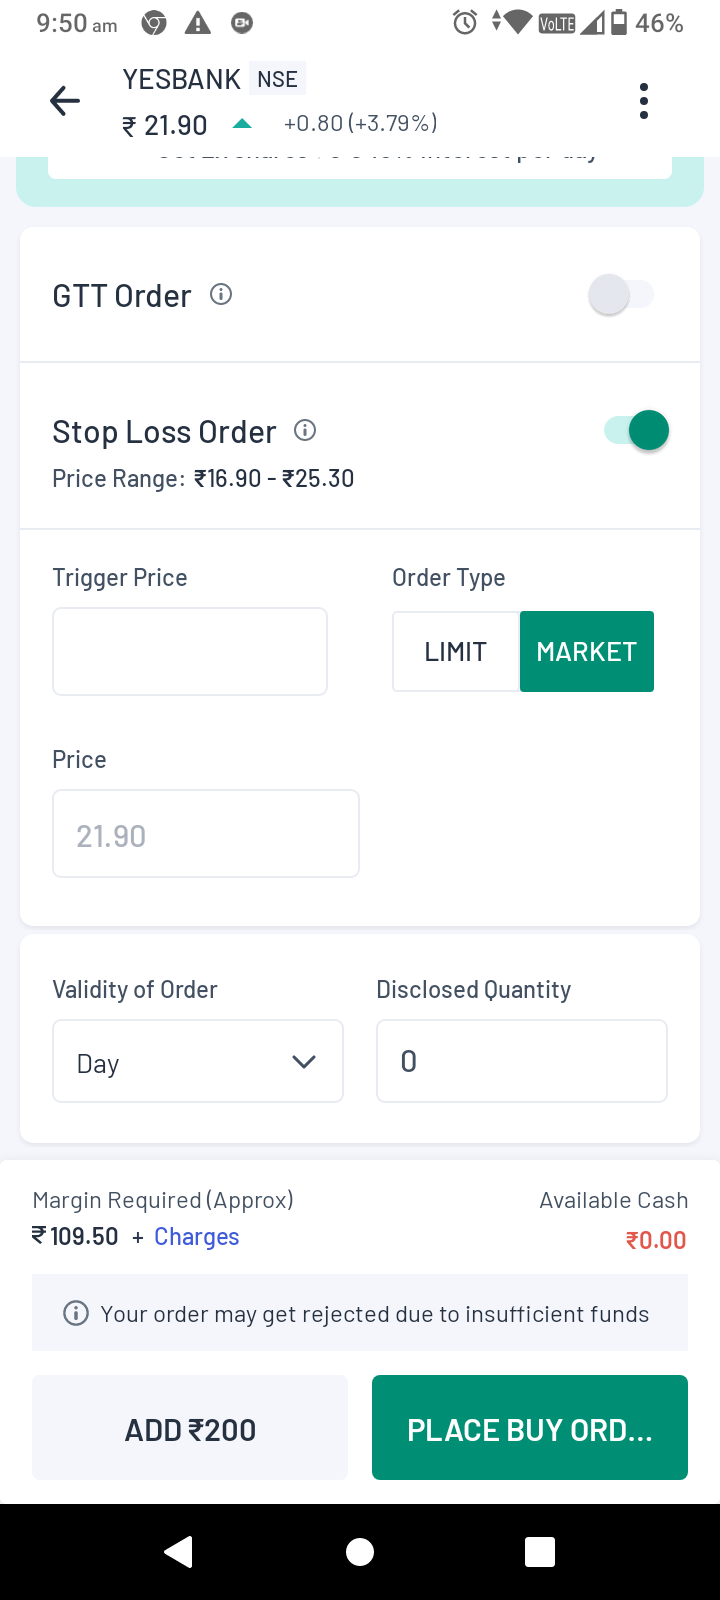 Figure: GTT Order details (left) and Stop Loss order details (right)
Cover Order
The cover order facility is only available for intraday orders. Upon choosing the order, you will be asked to provide the trigger price and limit price following which you can place the order. A cover order is made of two orders or ‘legs’ - the main leg and the secondary leg. The main leg is the primary position (i.e. buy/sell) and the secondary leg is meant to square off the position to limit the losses through a stop loss order. Example of Cover Order Suppose a stock is currently trading at ₹ 100. If your main leg is a sell order, you can set a limit order of ₹ 110 (usually a better/higher price than the market price) - the app will sell the stock when price reaches ₹ 110 or above (better). Then your secondary leg can be a stop-loss order set at ₹ 112 (the price at which the stock will be bought back to limit losses). So your potential losses will be limited to ₹ 2 while maximum gain will be ₹ 110 (in case stock price falls to ₹ 0). If your main leg is a buy order, you can set a limit order of ₹ 90. Then your secondary leg can be a stop-loss order set at ₹ 88 (the price at which the stock will be sold off to limit losses). Your potential losses will be limited to ₹ 2 while maximum gain will be unlimited.
Robo Order/Bracket Order
This facility is also available only for intraday orders. When you choose this order, you will be asked to enter the following details -
- Limit Price
- Stop Loss Price
- Target price
Once you have entered the details (including the quantity of assets to be traded), you can place the order. Example of robo/bracket order In the case of robo/bracket order as well, a main leg and a secondary leg is applicable. Suppose now, there is a stock that you want to trade that is currently being traded at ₹ 100. If your main leg is a sell order, then you set a limit order to sell the stock at ₹ 110. Simultaneously you can place a stop-loss order at ₹ 115 and a target price at ₹ 95 (i.e. the price at which you wish to square off your trade by buying back the stock eventually). Therefore your maximum potential loss will be limited to ₹ 5 (i.e. ₹ 115 - ₹ 110) and your maximum gain will be around ₹ 15 (i.e. ₹ 110 - ₹ 95). If your main leg is a buy order, then you set a limit order to buy the stock at ₹ 90. Simultaneously, you can place a stop-loss order at ₹ 80 along with target price at ₹ 105 (at which you plan to sell the stock eventually). Therefore, your maximum potential loss will be limited to ₹ 10 (i.e. ₹ 90 - ₹ 80) and your maximum gain will be around ₹ 15 (i.e. ₹ 105 - ₹ 90). Note: In case of cover orders or bracket orders, users cannot exit these positions from the ‘Positions” section (under “Orders”) itself. The user must open the individual order (under ‘Open Orders’) and cancel the second leg order (also called the ‘Child order’). Automatically, the entire cover order or bracket order will be exited. 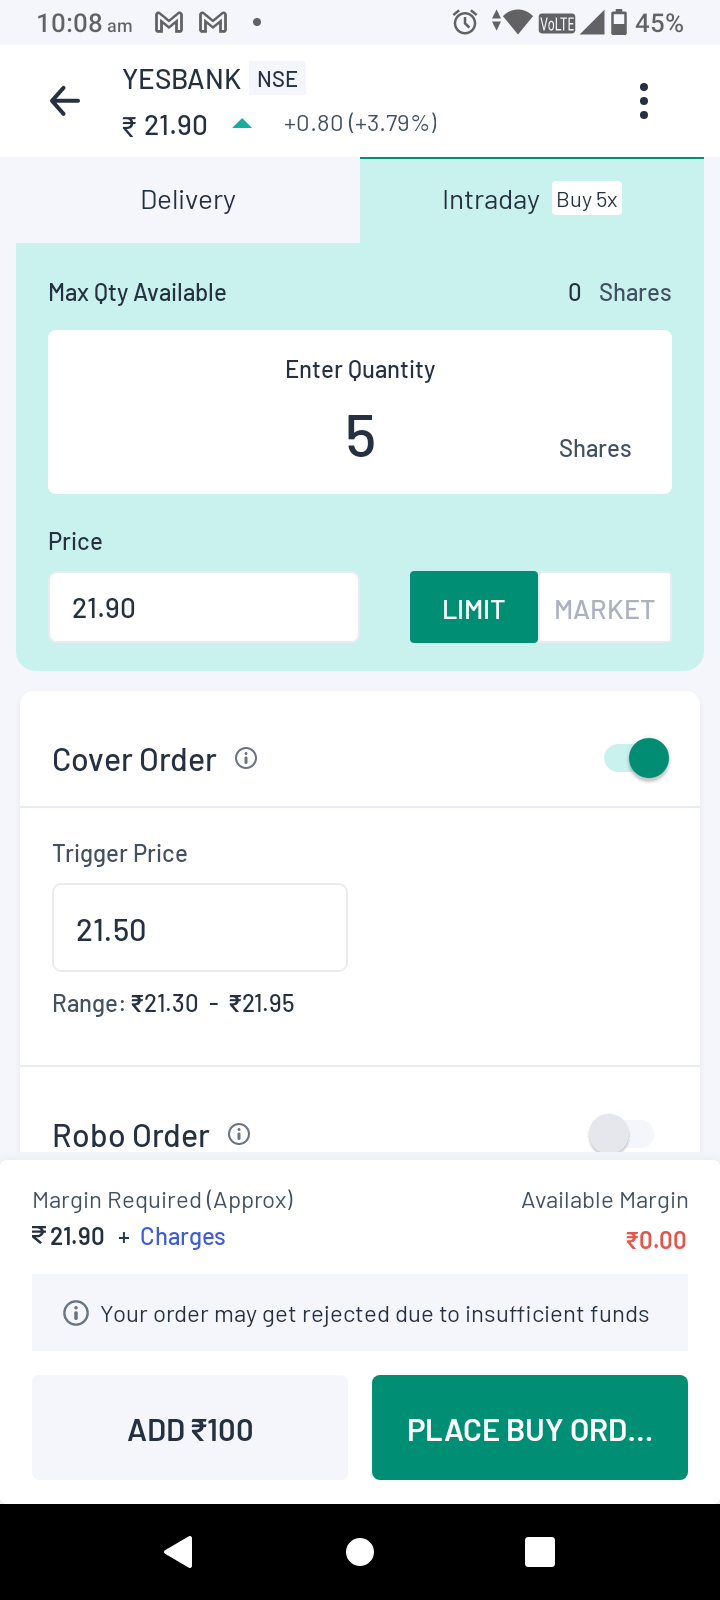
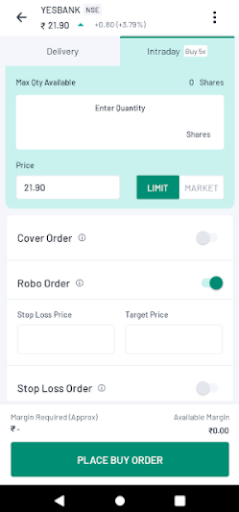 Figure: Cover order details (left) and Robo order details (right) Assume that you are about to place a stop loss order for a particular scrip. But you already have placed a stop loss order on that same scrip earlier. Then the app will notify you on the Orderpad itself that you already have a pending Stop Loss order for the scrip. Also, if an Exit order on a scrip exists already and you are about to place another Exit order on the same scrip, you will receive a similar nudge on the Orderpad.
Split Order
Split order is a facility which automatically breaks down a large order into smaller orders in order to fit the upper limit on lot sizes set by exchanges (also called the ‘freeze limit’). Earlier the orders had to be broken down manually by the traders but with split orders, the entire process now is automated and hence, much faster and easier for the traders. For example, suppose you are an options trader who wants to buy 50 lots of Nifty call options - but the upper limit of Nifty call options per order is 36 lots. Earlier, you would have to order 36 lots in one order and then again go through the entire order journey once more in order to order the remaining 14 lots. But with split order, you can enter the number of lots ordered as 50 and the app will automatically split the amount into two separate orders of 36 and 14 lots - you can then execute both the orders in one go by clicking “Proceed with 2 orders”. Brokerage charges will too be separately charged for each of these two orders. Therefore, if placing two orders took 2 orders took 2 minutes, then the time taken now is half or if placing 10 orders took 10 minutes, the time taken now is one-tenth and so on. 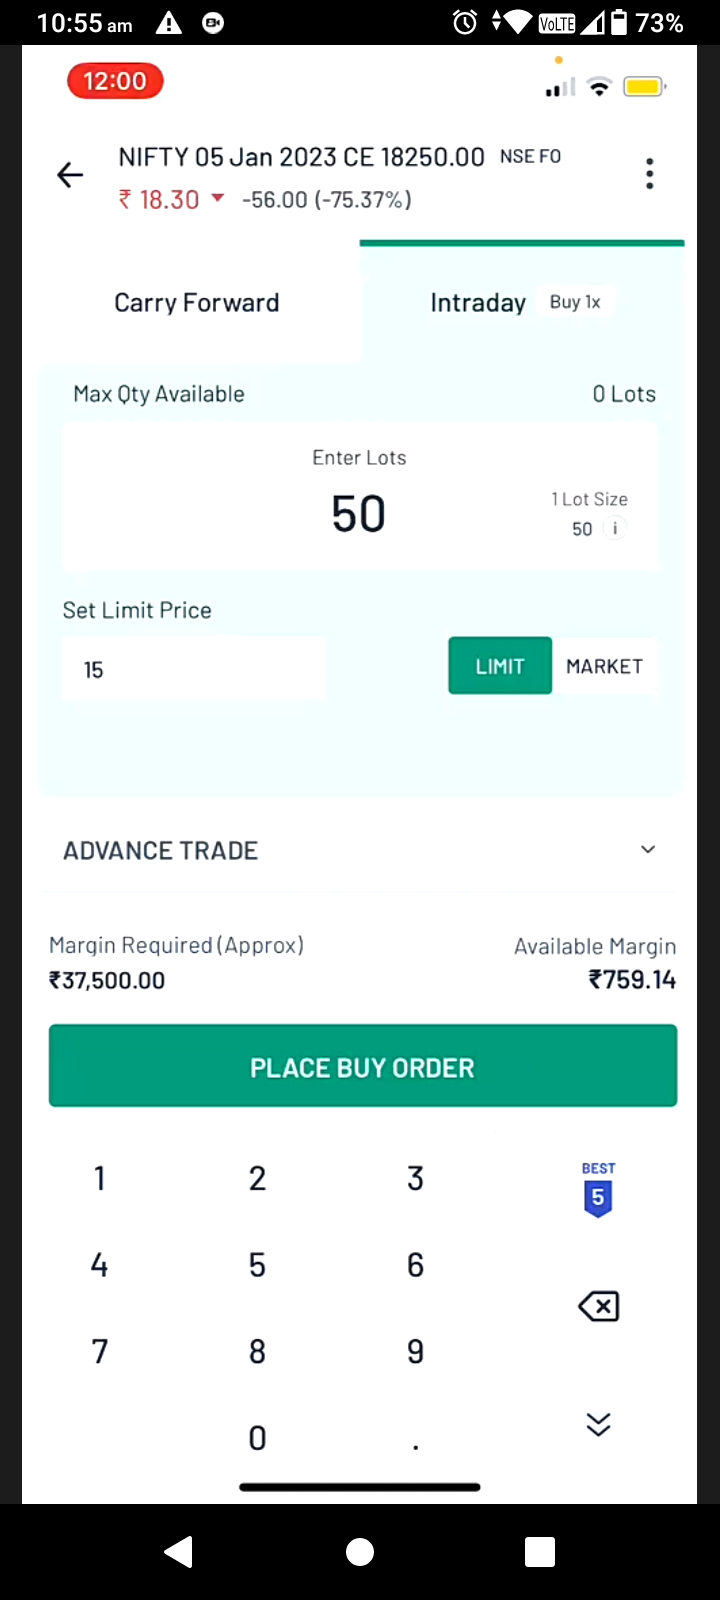
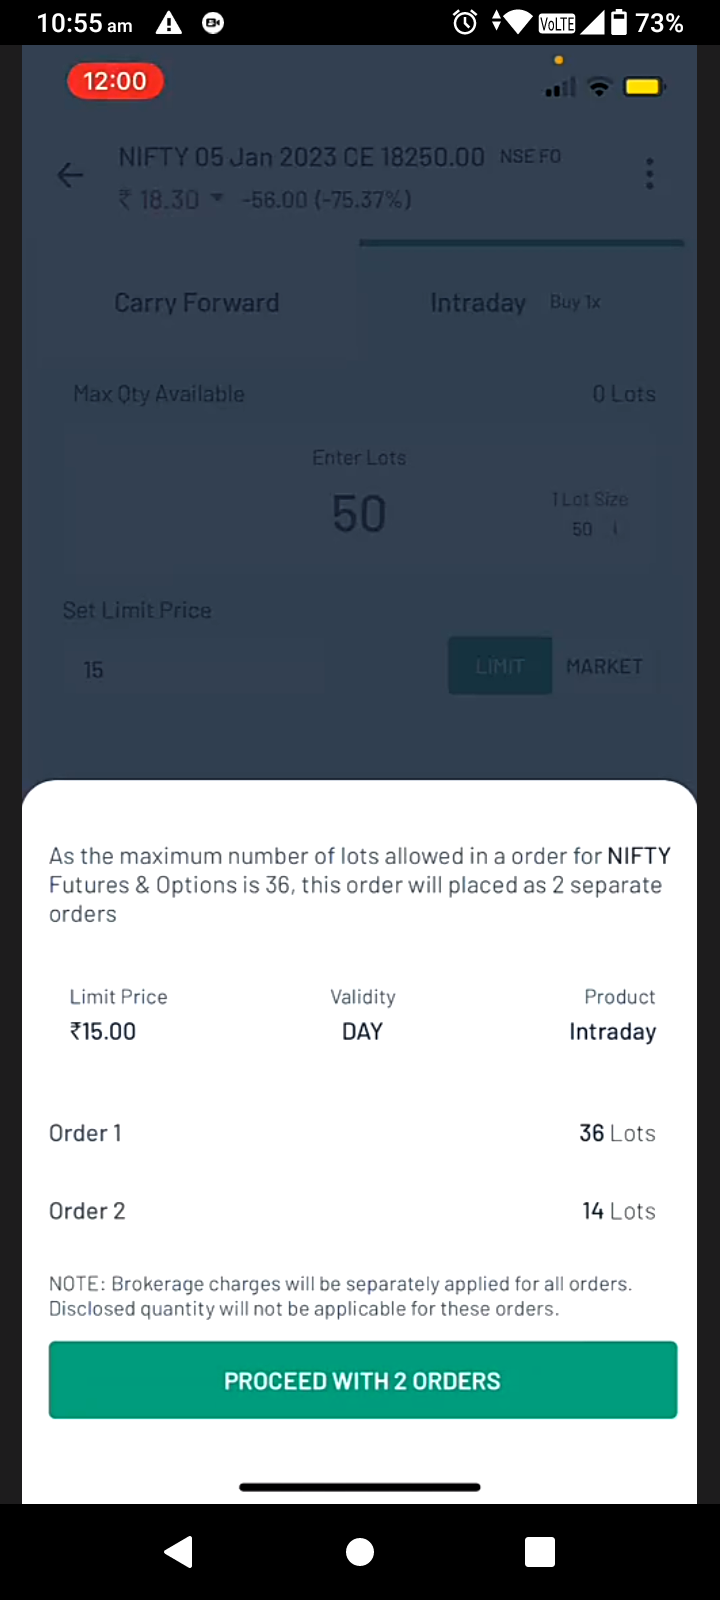 Fig.1: Just enter the number of lots you want, say 50 (left) and the app will split the order into a number that fits the upper limit requirements of the exchange (right)
Order rejection
The orders that you place may be rejected primarily because of the following two reasons -
- You do not have adequate cash in your trading balance
- The exchange has placed some restrictions on the trading of the scrip(s) e.g. for breaking the upper or lower circuits
- The order goes beyond the existing risk management rules
- Any other rules placed by the exchange
Out of these, rejection due to shortage of funds in your account can be avoided easily. Whenever you are about to mistakenly place an order that is going to be rejected, you will receive a nudge on the Orderpad itself reminding you that the order might be rejected due to insufficient funds. If you still go ahead and place the order, then an order sleeve will appear automatically (even before you place the order), providing you with the following options to avoid the order rejection -
- Add the funds needed to buy the desired quantity of assets. The option here will show you the exact amount that you need to add to buy the given quantity of assets. You can just check on the box next to this option and press the button below to add funds.
- Modify the quantity such that you can buy the asset with the existing funds in the account. The exact quantity that can be ordered using the existing funds will be stated already. You will simply have to click the ‘Place Order’ button to execute the order. If the funds are insufficient for even a single quantity then this option will not be shown to begin with.
- Pledge your existing holdings to increase the margin and thereby order the desired quantity of assets. Choose the option and click ‘Pledge’, the app will then redirect you to the ‘Pledge Holdings’ page. There you can increase your margin by increasing the assets pledged.
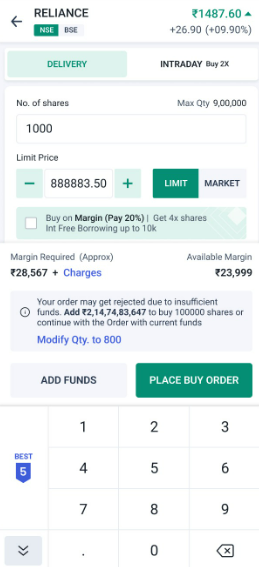
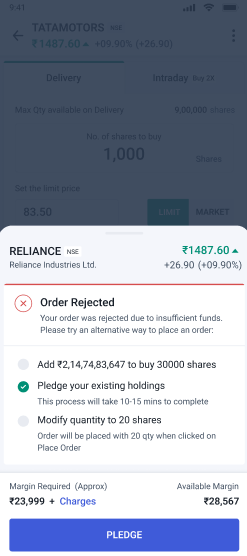
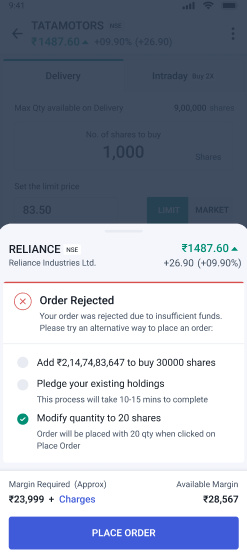 Figure: Nudge on Orderpad regarding possible rejection (left), pledge stocks to increase margin (middle) and modify quantity with a single click (right) If the order is still rejected then the Order Rejection sleeve will show again.
Markets
This section gives the following information about the security:
- Open, High, Low and Close prices
- Quantity and Price for buying and selling the security
- Average traded price
- Volume
- Upper control limit (UCL) and lower control limit (LCL)
- 52 week high and low
Option Chain
This section shows the option chain for the security under review. It shows the list of all options (calls on the left and puts on the right). At the centre we have the strike price and as we scroll away from the centre, we can see the following variables (arranged from nearest to the strike price to the farthest) -
- LTP Change - Last Traded Price (LTP) is literally the last price at which the security had been traded. LTP change shows by how much the LTP has changed in percentage terms, since the closing of the previous day.
- LTP - As stated before.
- OI - OI or Open Interest represents the total number of options for that particular asset and strike price that are currently active or open in the market.
- OI Change % - OI Change shows the percentage value by which the OI has changed since the beginning of trading hours on that particular day.
- Price change
- Volume
- Implied Volatility - The market’s forecast of change in the asset’s price.
- Delta - Rate of change of premium due to change in the price of the underlying asset.
- Theta - Rate of time decay of the premium of an option
- Gamma - Rate of change of the delta of an option due to change in price of the underlying asset
- Vega - Rate of change of price due to change in the volatility of the price of the underlying asset
Note: Delta, Theta, Gamma and Vega are Option Greeks All the above data are given for options on that particular asset that are expiring in the near month, next month and far month. For more frequently traded assets like the Nifty50 index, options for more expiry dates are also mentioned. Alongside this data, the current market price and the day’s change in price are also displayed. In addition to the above, the app also shows a rough idea about the market trend e.g. Long buildup or short covering along with the price and price change of the underlying asset. This is shown right at the middle of the chart where the options start changing from OTM to ITM. If the user wishes, he/she can view only the call options or only the put options for better clarity. Moreover, he/she can also switch to the option chain of a different asset by searching for it on the search icon on the top right. This is not all regarding options however, as there is further derivatives-related data mentioned under the “Derivatives” section of the asset.
The Angel One User Manual is your complete guide to navigating our trading and investment platform with ease. Whether you are opening your first Demat account, placing an equity order, setting up an SIP, or applying for an IPO, our step-by-step guides help you understand every feature in detail. From login and dashboard navigation to advanced order types and reports, the user manual ensures you get the most out of Angel One. Designed for both beginners and experienced traders, it brings clarity to every action you take on our platform.
