A lack of systematic reflection causes traders to frequently make the same mistakes. The Trading Insights tool helps you find trends and improve your strategy.
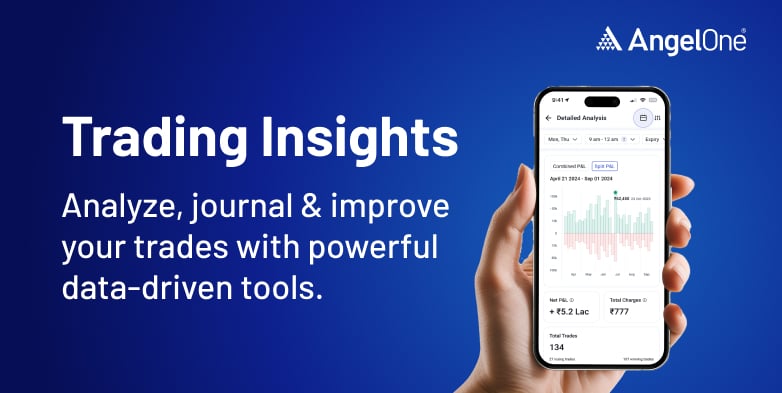
Trading Insights is a trade analytics and journaling tool that helps users review performance over custom timeframes or daily snapshots.
Traders lack structured ways to reflect on performance, leading to repeated mistakes. This feature enables data-driven self-improvement and disciplined strategies.
The tool enables fast reflection on trades, patterns, and discipline.
Risk management is central:
Traders can track if they are maintaining risk per trade and stop loss per trade.
Fixed risk per trade allows consistency (e.g., ₹1 lakh capital → 1% risk per trade = 100 trades).
Helps build better performance over time.
The feature highlights bigger drawdowns and whether risk rules are being broken (e.g., exceeding ₹1,000 risk per trade but losing ₹3,500 in a day).
Profits and losses have different patterns; insights help traders understand how both behave.
Systematic performance comes from analysing trades daily + journaling consistently.
Discover performance patterns based on time, instrument, or strategy
Benchmark current performance against past trades
Reflect on their actions with journaling to build self-awareness
Continuously evolve their trading game with data-backed decision
1. Date Range View: It offers F&O and Cash trade analytics by time of entry with key metrics like Win/Loss %, Risk-Reward, P&L, Charges.
2. Date Wise View: It explores day-wise trades, adds text notes, and entry/exit on charts.
3. Advanced filters: It filters and analyses by hour, weekday, individual index/scrip, or holding duration, with P&L growth charts and other relevant metrics
Trading Insights provides two distinct views for flexibility and depth:
● Date Range View: Analyse realised trades across any custom period —weekly, monthly, or yearly—with powerful metrics such as Win/Loss %, Risk-Reward Ratio, Net P&L, and Charges. This view helps users assess performance trends and compare periods to gauge progress.
● Date Wise View: Review day-by-day trade activity in a calendar layout. Traders can journal their thoughts by adding date wise text notes, checking the day’s net profit, seeing a breakdown of individual trade outcomes, and visually mapping their trade entries and exits on charts for better clarity and learning.
And, advanced filters allow users to customise their analysis by specifying hours, weekdays, indexes, scrips, and holding duration. P&L growth charts and cumulative summaries provide micro and macroeconomic insights, allowing traders to make informed decisions.
Date range, Calendar view, and advanced filters show the following:
Summary by Date Range | Calendar View | Advanced Filters based Analytics |
1. Net P&L | 1. Add text notes | 1. Filter reports by hour, day wise, individual index, scrips, or holding |
Integrated with Angel One platform (no third-party tools required).
Combines analytics + journaling in one place.
Flexible views and advanced filtering.
Trading Insights makes strategy review and improvement easier than ever. Use the Trade Analytics tool to transform raw numbers into powerful strategies. Take the edge of technology and explore more on Angel One!
Disclaimer: This blog has been written exclusively for educational purposes. The securities mentioned are only examples and not recommendations. This does not constitute a personal recommendation/investment advice. It does not aim to influence any individual or entity to make investment decisions. Recipients should conduct their own research and assessments to form an independent opinion about investment decisions.
Investments in the securities market are subject to market risks, read all the related documents carefully before investing.
Published on: Oct 3, 2025, 4:20 PM IST

Team Angel One
We're Live on WhatsApp! Join our channel for market insights & updates

Get the link to download the App

