
With price volume support, Vascon Engineers and United Drilling Tools are strong bullish breakout potential stocks. The stock prices have displayed a breakout and bounced back from support, and both presently trading at Rs 90.80 and Rs 307. The breakout and bounce back align with positive signals from technical indicators such as RSI, ADX, and other key metrics, reinforcing the likelihood of continued upward momentum.
Vascon Engineers Ltd
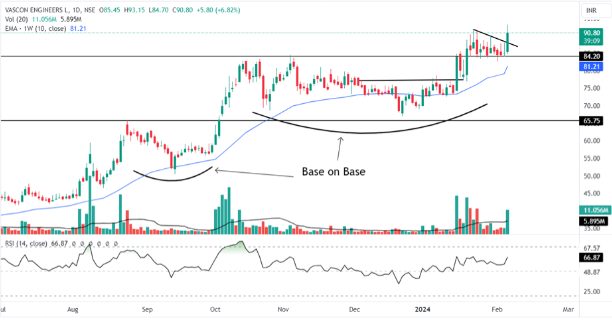
Daily chart of Vascon Engineers Ltd
Vascon Engineers is currently displaying sustained bullish momentum on the daily chart, characterised by a notable breakout from a basing pattern earlier. This breakout is supported by the good volume observed 2-week back, highlighting active buyer participation with substantial daily volume today.
Tuesday’s trading session began at Rs 85.45 and reached a peak of Rs 93.15. After 10 days of cool down, the stock has successfully breached the upper resistance or 52-week high, indicating a potential continuation of the long-term uptrend.
The current stock price is trading near a 52-week high, driven by increased volume during a particular trading session, indicating that investors are interested in up moves. The stock price has retested the previous breakout level, which may set Vascon Engineers up for a stronger positive trend shift, and the accumulated volume suggests further growth shortly. The bounce from the near-lower resistance acted as support, emphasising the stock’s effort to establish new highs.
On the RSI chart, the relative strength index crossed the level of 65 with a similar pattern formation, and ADX trading at 31 indicates good directional strength, favouring a few sideways movements. In the event of a retracement, it is essential to monitor key support levels, particularly at Rs 84.20. The upper resistance is uncertain for the stock, and the overall favourable structure is maintained as the stock consistently trades above crucial moving averages, affirming a sustained long-term upward trend.
Vascon Engineers Ltd engages in the construction and development of residential and non-residential properties.
United Drilling Tools Ltd
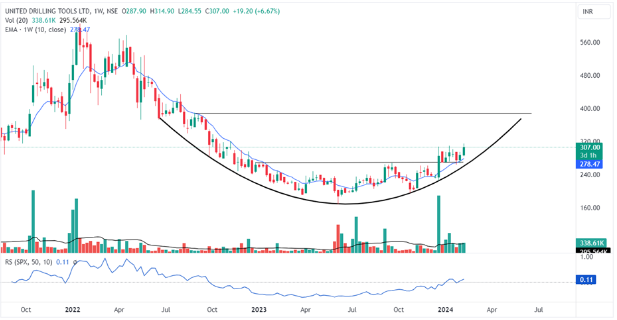
Weekly chart of United Drilling Tools Ltd
United Drilling Tools’ current stock performance is characterised by a strong green candle trading at Rs 307 and has the potential to continue this strong uptrend, accompanied by a significant increase in trading volume today. Currently, the stock price is forming a rounding bottom pattern and acting on the same trajectory.
Starting at Rs 295.80 on Tuesday, the stock reached an intraday high of Rs 314.90. The last two days’ upsurge is notable as they followed a few days of consolidation, suggesting a likely continuation of the bullish trend if the price manages to close above new higher highs.
The next level of the breakout occurred with a closing of the day candle above the all-time high, indicating bullish momentum. After reaching its 52-week high, the stock may witness a rapid ascent in the day trading sessions, following sustained levels near Rs 320. The current market action is supported by a surge in price volume, surpassing the typical trading day volume.
The relative strength index (RSI) recently traded in a bullish range at 63.62, suggesting the potential for a significant upward movement in the stock price is still there, particularly as it continues to trade above this level. The ADX, currently at 27, indicates good directional strength with smaller sideways movement. The Relative strength against Nifty 50 suggests the outperformance of the stock as shown in the above chart. The 10-week Exponential Moving Average (EMA) serves as a crucial support level during larger corrective movements after the breakout, and the overall market structure favours traders if the stock consistently trades above major moving averages.
United Drilling Tools Ltd manufactures drilling tools and equipment.
Disclaimer: This blog has been written exclusively for educational purposes. The securities mentioned are only examples and not recommendations. The information is based on various secondary sources on the internet and is subject to change. Please consult with a financial expert before making investment decisions.
Published on: Feb 6, 2024, 4:38 PM IST
We're Live on WhatsApp! Join our channel for market insights & updates

Get the link to download the App

