
Indian Information Technology (IT) sector has been one of the most important drivers of GDP Growth. With the Indian IT sector has helped the services and exports growth, it has played a pivotal role in making India’s presence felt all over the globe. No wonder, Indian IT’s core competencies and strengths have attracted significant investment from major countries. The computer software and hardware sector in India attracted cumulative foreign direct investment (FDI) inflows worth USD 69.29 billion between April 2000 and September 2020. The sector ranked 2nd in FDI inflows as per the data released by Department for Promotion of Industry and Internal Trade (DPIIT). In FY21, computer software and hardware topped FDI investments, accounting for 44 percent share of the total FDI inflows of USD 81.72 billion.
Important factor is the way the world has changed during and post Covid-19 pandemic, IT as a sector has played an important role. Be it the use of Technology to work from home or the digitisation of payments – the Indian IT sector has played an important role. As regards the overall growth prospects, India is the topmost offshoring destination for IT companies across the world. Having proven its capabilities in delivering both on-shore and off-shore services to global clients, emerging technologies now offer an entire new gamut of opportunities for top IT firms in India. The industry is expected to grow to USD 350 billion by 2025. Here we present the top ten IT Companies in India in terms of market capitalisation. However before that let’s take a look at a few of the current important data points in the sector.
When we take a look at the IT sector, it is important to focus on how the new deal flow is. And Indian IT companies have scored well on this parameter. The following chart clearly shows how since 2019 most of the leading companies have managed to sustain growth on this parameter.
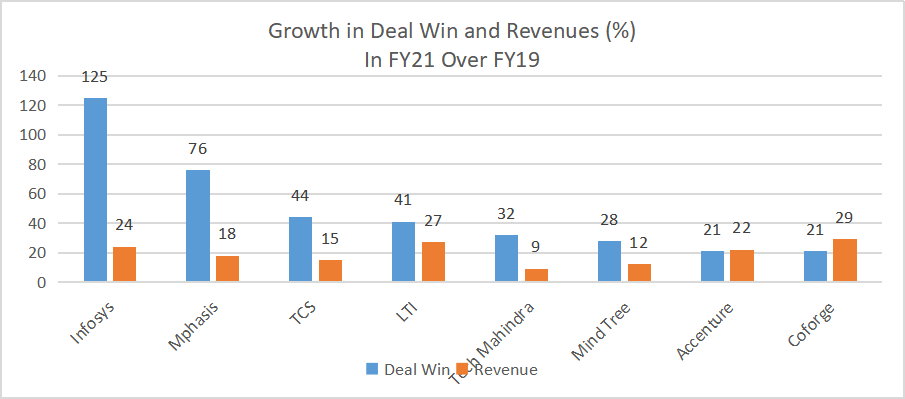
The above chart clearly shows the deal Win has increased significantly in FY21 over FY19. Naturally Infosys is the clear winner here with more than 100 percent growth in deal wins. However the companies like Coforge and L&T InfoTech score well on the revenue growth front. We opine the deal wins would continue in FY22 as well resulting in better revenue visibility in FY22.
The next important parameter is the consistency on the Margins front as well. Here in the chart below we are providing a list of companies that posted strong growth on the margins front in FY21.
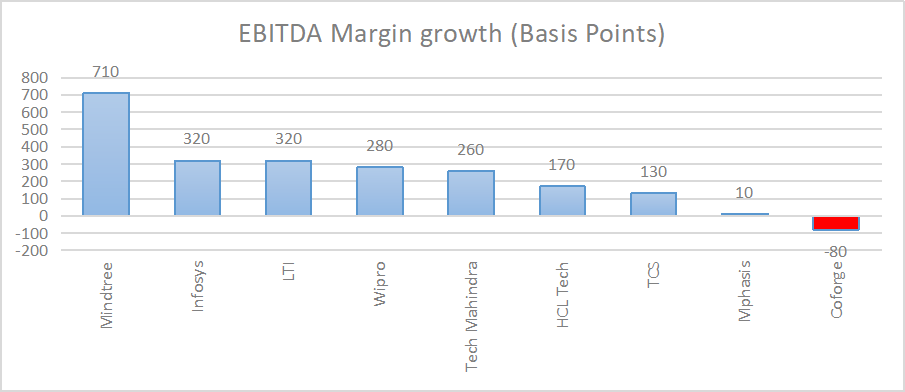
While the majority of the companies have posted improvement on the EBITDA margins front, Coforge witnessed some pressure and posted some margin decline. Mindtree emerges the best player on the margin improvement front.
Third important parameter is the constant currency growth and bottomline. Here the following table shows how the various companies have performed in various quarters in previous fiscal FY21.
| CC Growth % | EBIT margin (bps) | Pat % | ||||||||||
| 1QFY21 | 2QFY21 | 3QFY21 | 4QFY21 | 1QFY21 | 2QFY21 | 3QFY21 | 4QFY21 | 1QFY21 | 2QFY21 | 3QFY21 | 4QFY21 | |
| Infosys | 3 | 1.5 | 2.3 | -1 | 200 | 250 | 20 | 30 | 7.8 | 7.8 | 2.2 | -1 |
| TCS | -1.7 | 1.9 | 1.5 | 0.1 | -80 | 130 | 130 | 10 | -8.8 | 5.4 | 1.9 | – |
| Wipro | -0.6 | 0.4 | 0.6 | – | 260 | -10 | 250 | 50 | 11.2 | -2.2 | 15.5 | 3.8 |
| HCL Tech | -0.1 | 0.8 | 0.8 | -0.5 | 120 | 80 | 180 | -130 | 8.9 | 5.1 | 24.4 | -15.6 |
| TechM | 2 | 1 | 0.7 | -1.2 | 120 | 230 | 130 | 70 | 32.9 | 12.8 | 14.9 | -16.5 |
There are few misses on the PAT growth in Q4FY21. Rest Most of the matrix remains strong. HCL Tech and Tech Mahindra witnessed some pressure in Q4FY21.
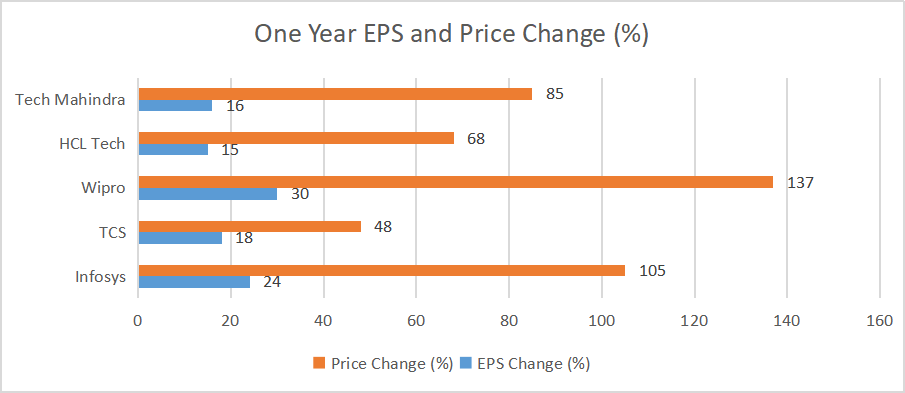
As regards the performance of top companies on the EPS growth front and change in price on the bourses, it is Wipro that has managed to post best EPS growth. Even the investors were quick to reckon the same and up-move in price has also been highest in Wipro. Wipro had underperformed over the past few years and hence the catch up game was anyway expected. On the price gain part Infosys stands second and Tech Mahindra stands third. We must remember that TCS and Infosys had also announced a Buy Back in the past one year.
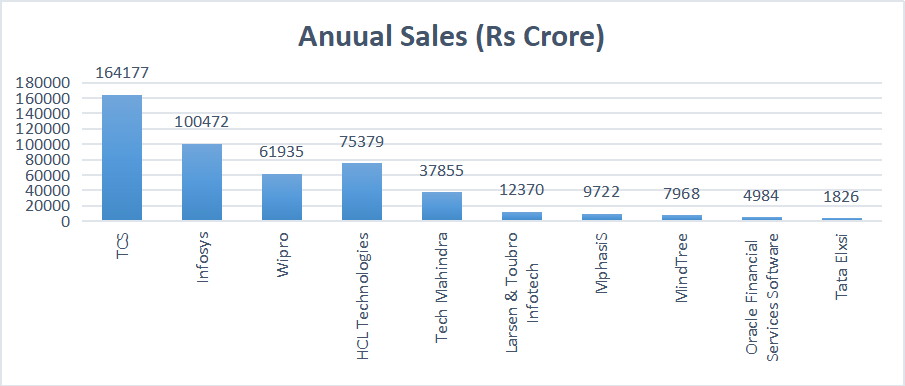
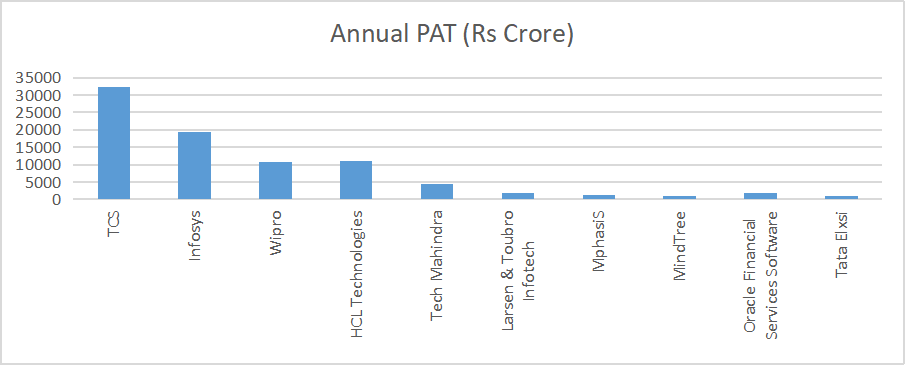
While we are done with the update of few sector parameters, let’s take a look at the top ten companies on the basis of market capitalisation. The following chart shows the list of companies.
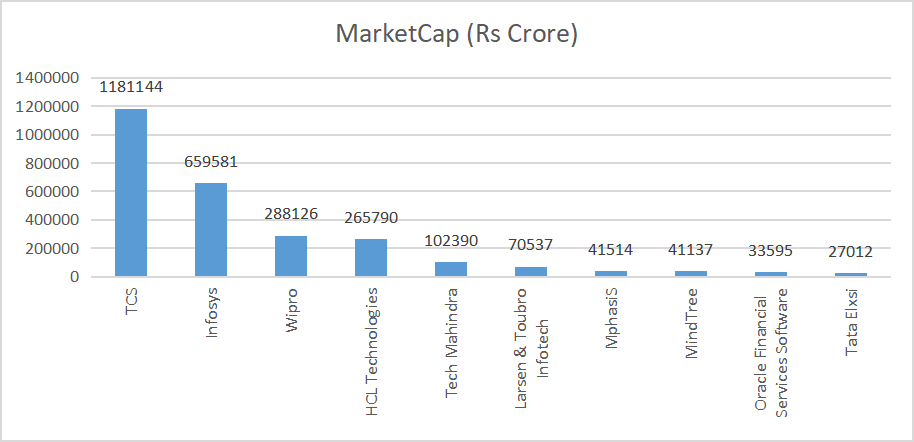
The above chart shows as on July 12, 2021 TCS is ranked at the top with a market capitalization (Number of Outstanding shares * Current market price) of Rs 11,81,144 crore. It is followed by Infosys with a market Cap of Rs 6,59,581 crore. There is a huge gap between first and the Second and even the second and the third. Wipro stands third with a market cap of Rs 2,88,126 crore. Let’s take a look at all the top ten Stocks one by one. However before we get into the charts and stock price movement, we are providing the chart showing sales and PAT of all Top ten companies based on market capitalization. Here also TCS tops the list on Topline as well as PAT numbers. In absolute terms TCS has always been the leader on Sales revenues and even on the PAT basis. Following chart shows how the top three have been consistent performers and hence enjoy a premium over other players.
Let’s have a look how the top players have performed on the bourses over past few years. The charts clearly indicate how the IT sector has been a favourite sector and almost all the leading players have generated significant returns for the investors.
As stated earlier Tata Consultancy Services (TCS) has topped the charts on all parameters. Be it the sales revenues, profit after tax and the market cap- TCS has been ranked at the top. No wonder even the scrip movement has been strong, especially after the buyback announcement.
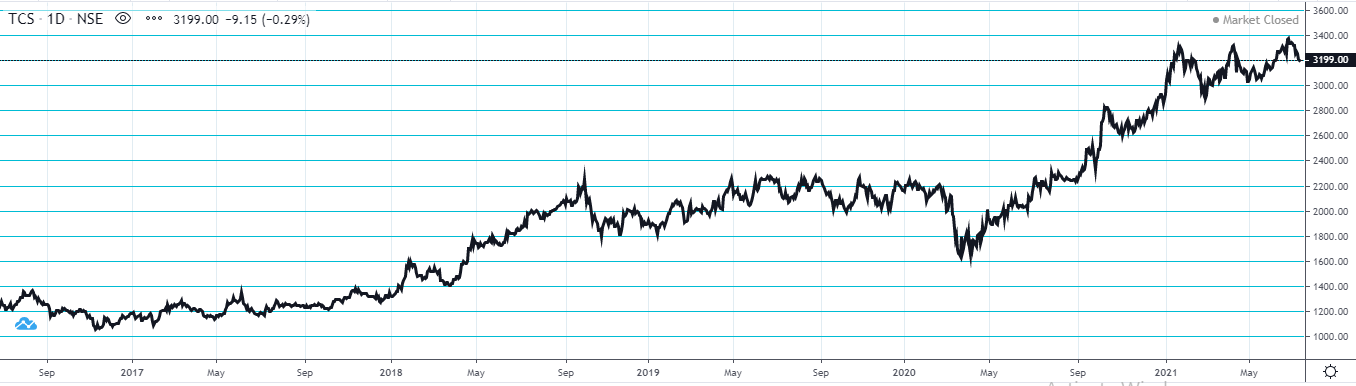
While for FY21 the company posted a topline of Rs 1,64,177 crore the PAT for FY21 stood At Rs 32,430 crore. As for TCS the scrip made 52 week high of Rs 3399 on June 25, 2021 and had hit a 52 week low of Rs 2125 on July 24, 2020.
Second on the list is Infosys with a market capitalisation of Rs 6,59,581 crore. While the topline for FY21 was Rs 1,00,472 crore the PAT was 19,351 crore.
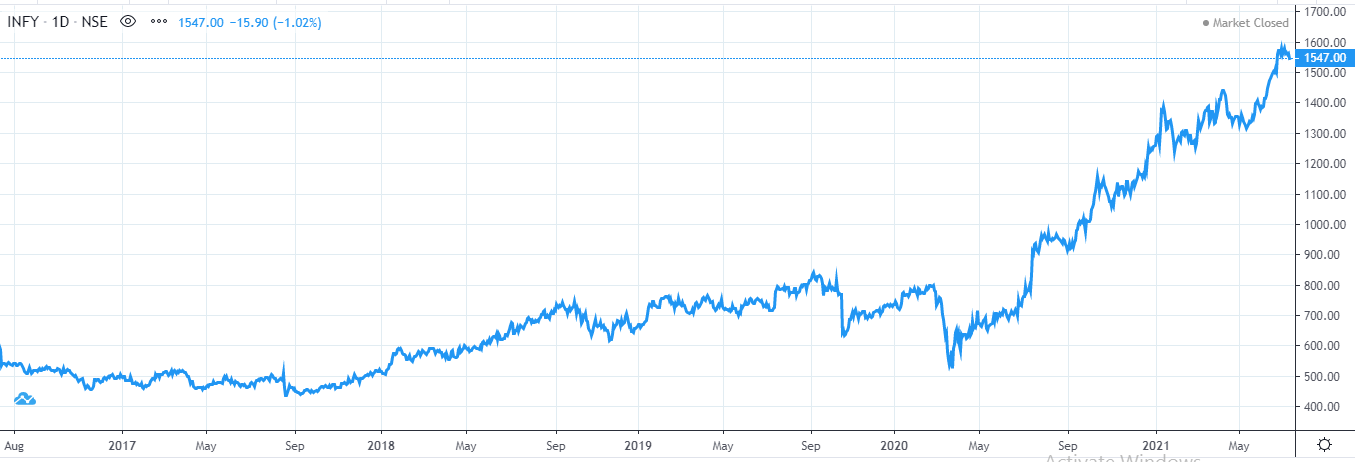
As regards the stock movement, the scrip hit a 52-week high of Rs 1591 on June 30, 2021 and 52 week low was Rs 773.50 on July 10, 2021.
Wipro stands at the third positive with a market cap of Rs 2,88,126 crore as on July 12, 2021. Naturally the gap has been very large between top 2 and the third player.
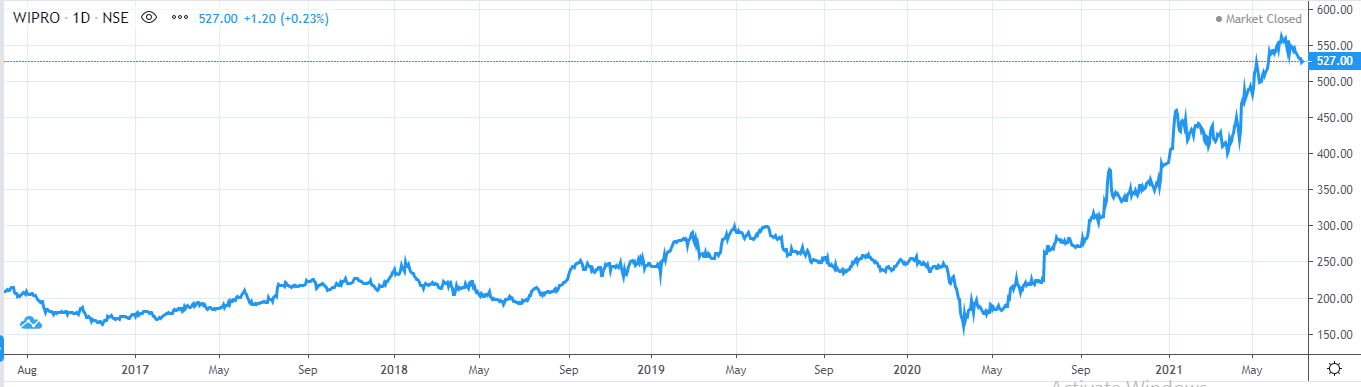
As regards the financial performance, Wipro posted a topline of Rs 61935 crore and PAT of Rs 10796 crore for FY21. The 52 week high for the scrip was Rs 564 made on June 15, 2021and the 52 week low price was Rs 219.50 posted on July 10, 2020.
The fourth on the list is HCL Technologies with market capitalisation of 2,65,790 crore. On the financial parameters it posted a topline of Rs 75,379 crore and PAT of Rs 11145 crore. While the absolute numbers are better than Wipro the scrip has not got premium on the bourses yet.
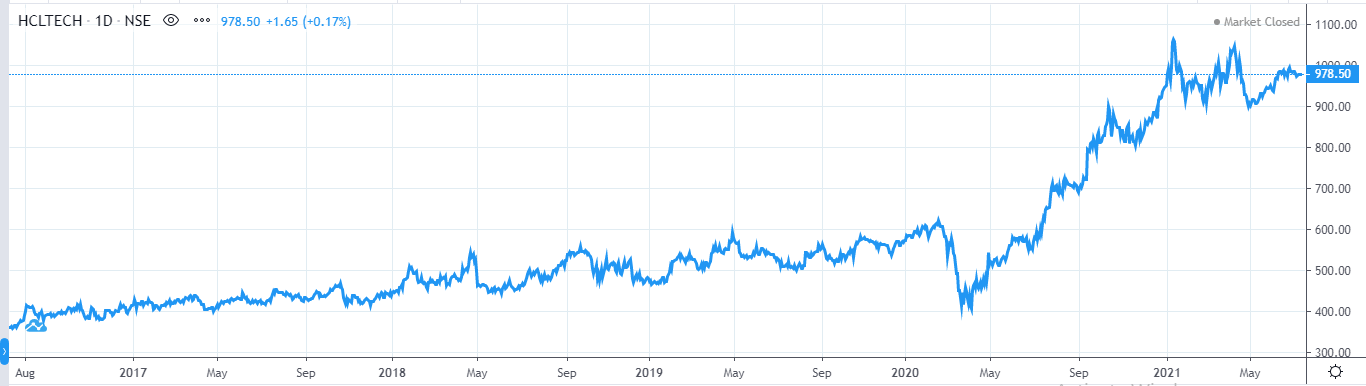
While the 52 week high for the scrip was Rs 1067 made on January 13, 2021. The 52 week was hit on July 9, 2021 at Rs 575.
The fifth on the top list is Tech Mahindra with a market cap of Rs 1,02,390 crore. The topline for FY21 was Rs 37855 crore and the PAT was Rs 4428 crore.
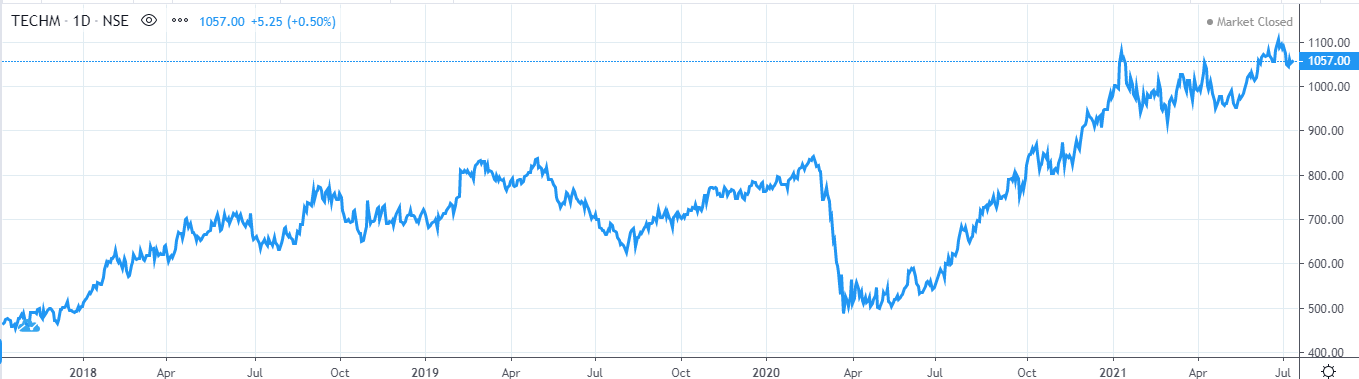
Tech Mahindra hit a 52 week high price of Rs 1109 on June 29, 2021 and 52 week low price of Rs 561.35 was touched on July 10 2020.
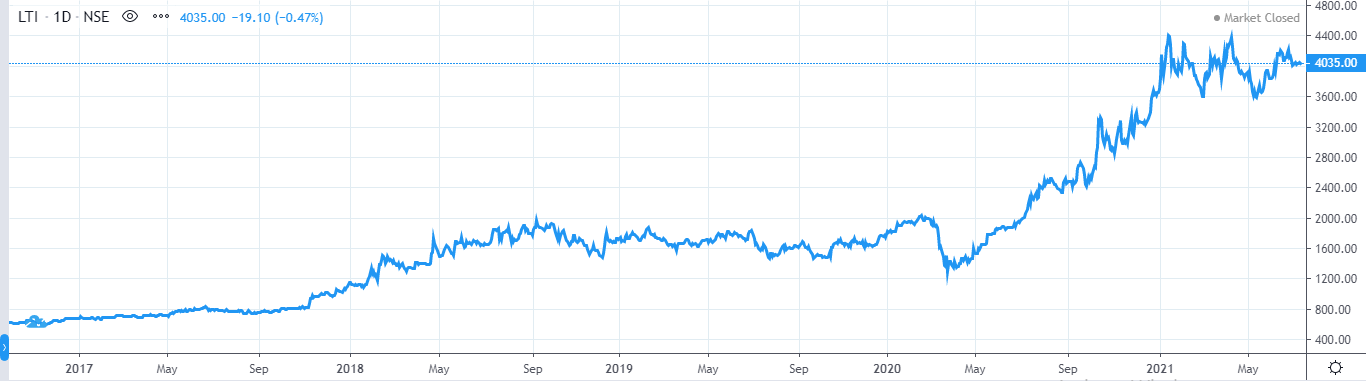
As regards the next five ranks, we have provided the price charts a 52 week high low dates and prices. The revenue and PAT of the companies have been already provided in the chart posted above. One can look for the numbers.
L&T Infotech (52 week High Rs 4483 June 15, 2021,52 week low Rs 2035.65 on July 9, 2020)
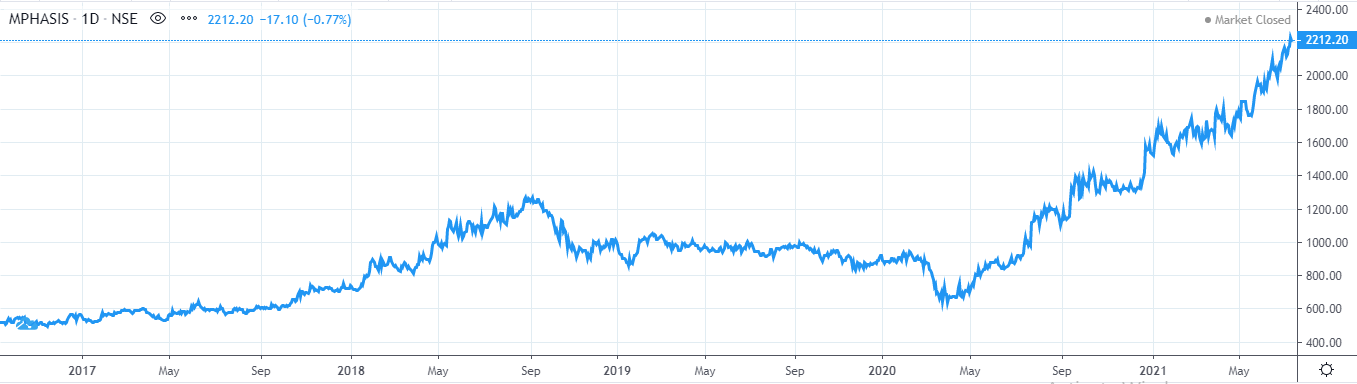
Maphasis (52 week High Rs 2269 on July 7, 2021,52 week low Rs 885.5 on July 10, 2020)
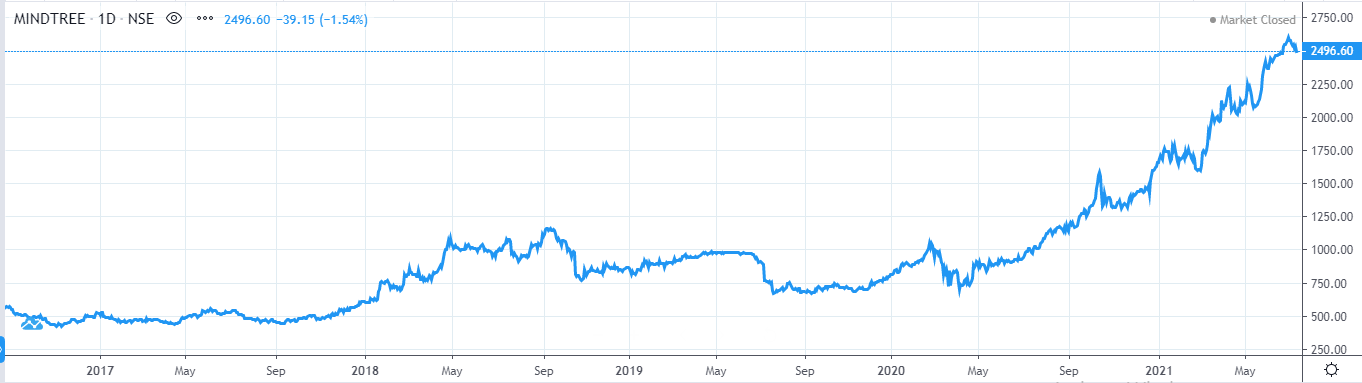
Mindtree (52 week High Rs 2618 on June 30, 2021,52 week low Rs 963 on July 15, 2020)
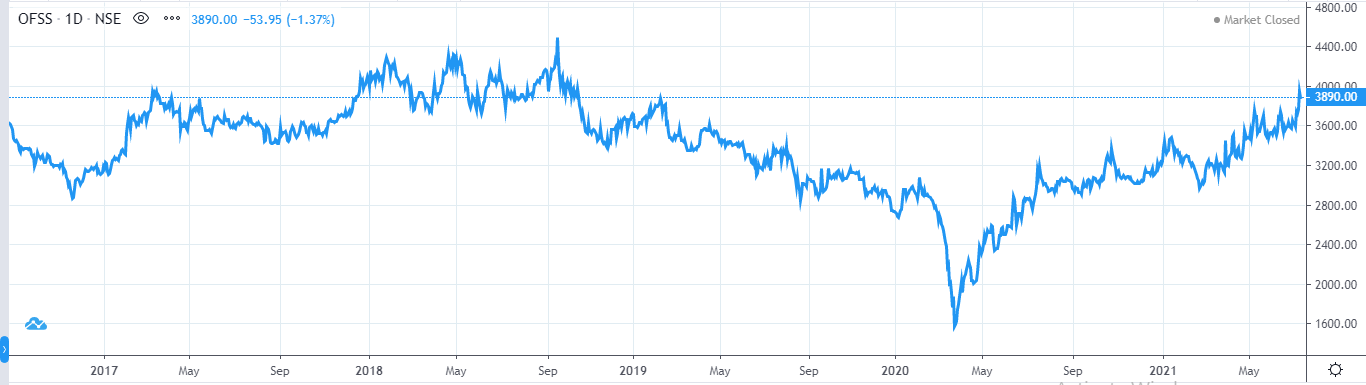
OFSS (52 week High Rs 3983 on July 12, 2021,52 week low Rs 2732 on July 13, 2020)
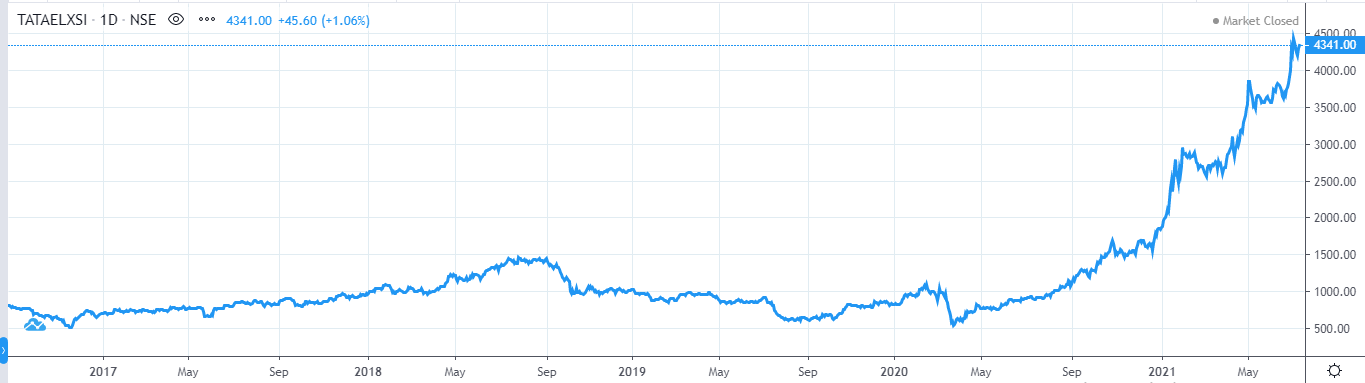
Tata Elxsi (52 week High Rs 4465 on July 5, 2021, 52 week low Rs 876 on July 14, 2020)
While the stock may look to have run up quickly the sector still has potential and stock specific opportunities are available in the sector.
Published on: Aug 31, 2021, 1:07 AM IST
We're Live on WhatsApp! Join our channel for market insights & updates

Get the link to download the App

