
Vodafone Idea Ltd experienced notable trading activity today with a high of Rs 13.7 and a volume of 2.15 billion shares due to the block deal. Today the stock recorded the highest volume in a trading session since its inception. The stock is currently trading at Rs 13.45, down by 3.24% from its previous close of Rs 13.9. With today’s trading, the market capitalization of Vodafone Idea stands at approximately Rs 67,763.59 crore, reflecting significant investor interest and market movements.
Vodafone Idea’s shares saw a significant increase of 25% above their Follow-on Public Offer (FPO) price of Rs 11, reaching a peak of Rs 13.75 during morning trade. The successful raising of Rs 18,000 crore in India’s largest FPO, which attracted institutional investors and was subscribed 6.36 times on the final bidding day, surged the stock price. Institutional buyers led the demand, subscribing 17.56 times their portion, while non-institutional investors and the retail segment subscribed 4.13 times and fully, respectively.
The proceeds from the FPO will mainly be used for network expansion and upgrades. Vodafone Idea plans to allocate Rs 12,750 crore to enhance its infrastructure, which includes establishing new 4G and 5G sites and increasing the capacity of existing 4G sites. This strategic investment aims to improve service quality and expand coverage, capitalizing on the renewed investor interest and robust market demand.
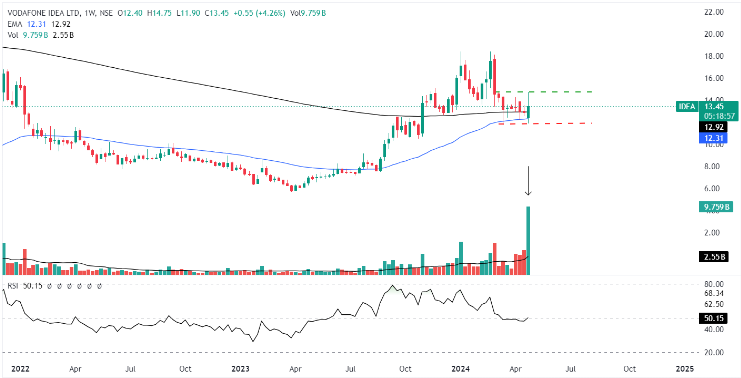
Weekly chart of Vodafone Idea Ltd
The above chart of Vodafone Idea shows an impressive technical setup take a bet on where the risk-reward seems favorable. As the 2000 crore change of hands is successful the stock is in the limelight with its FPO the volume bar marked on the chart clearly shows the highest volume recorded till now.
The stock price on the weekly chart is trading above its 50-day EMA and 200-day EMA looks like getting ready for the pullback. The range marked on the chart of Rs 11.90 to Rs 14.70. The 50-day EMA and 200-day EMA are about to cross and signal a golden cross. The 50-day EMA crossing above the 200-day EMA will give confidence in the bullishness of the stock.
Traders who are looking for a potential trade-in Vodafone Idea Ltd can enter the stock with the current market price, keep a stop loss below 50-day EMA, and aim for the target above 52-week high.
Investors can start accumulating stock by 10% of their proposed amount and invest 100% on the confirmation of Golden Cross.
The stock has shown impressive price growth in the last year. The shares of Vodafone Idea have logged multibagger returns of 103% in a year. Investors should keep an eye on this telecom penny stock.
Disclaimer: This blog has been written exclusively for educational purposes. The securities mentioned are only examples and not recommendations. The information is based on various secondary sources on the internet and is subject to change. Please consult with a financial expert before making investment decisions.
Published on: Apr 26, 2024, 4:26 PM IST
We're Live on WhatsApp! Join our channel for market insights & updates

Get the link to download the App

