Stock Brokers can accept securities as margin from clients only by way of pledge in the depository system w.e.f. September 1, 2020.
- Update your mobile number & email Id with your stock broker/depository participant and receive OTP directly from depository on your email id and/or mobile number to create pledge.
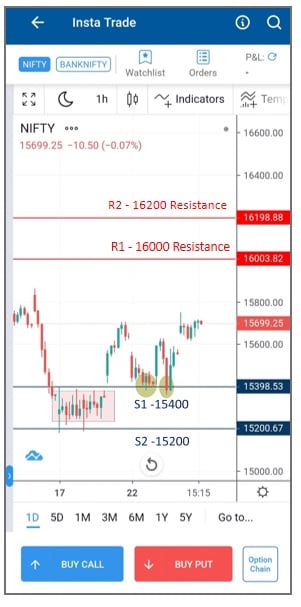
- Pay 20% or "var + elm" whichever is higher as upfront margin of the transaction value to trade in cash market segment.
- Investors may please refer to the Exchange's Frequently Asked Questions (FAQs) issued vide circular reference NSE/INSP/45191 dated July 31, 2020 and NSE/INSP/45534 dated August 31, 2020 and other guidelines issued from time to time in this regard.
- Check your Securities /MF/ Bonds in the consolidated account statement issued by NSDL/CDSL every month.
Prevent Unauthorised transactions in your Trading/Demat Account. Update your mobile numbers/email IDs with your stock brokers/Depository Participant. Receive alerts/information of your transaction/all debit and other important transactions in your Trading/ Demat Account directly from Exchange/CDSL at the end of the day. Issued in the interest of investors.
KYC is one time exercise while dealing in securities markets - once KYC is done through a SEBI registered intermediary (broker, DP, Mutual Fund etc.), you need not undergo the same process again when you approach another intermediary.
No need to issue cheques by investors while subscribing to IPO. Just write the bank account number and sign in the application form to authorise your bank to make payment in case of allotment. No worries for refund as the money remains in investor's account.
We understand that certain investment advisors may be approaching members of the public including our clients, representing that they are our partners, or representing that their investment advice is based on our research. Please note that we have not engaged any third parties to render any investment advisory services on our behalf. We do not share our research reports or our clients’ personal or financial data with any third parties and have not authorized any such person to represent us in any manner. Persons making investments on the basis of such advice may lose all or a part of their investments along with the fee paid to such unscrupulous persons. Please be cautious about any phone call that you may receive from persons representing to be such investment advisors, or a part of research firm offering advice on securities. Do not make payments through e-mail links, WhatsApp or SMS. Please do not share your personal or financial information with any person without proper verification. Always trade through a registered broker.
Issued in public interest by Angel One Limited, having its registered office at 601, 6th Floor, Ackruti Star, Central Road, MIDC, Andheri East, Mumbai - 400093, Telephone: +91 22 4000 3600, Fax: + 91 22 2835 8811.