

Below was our analysis for this expiry:
Chart Analysis
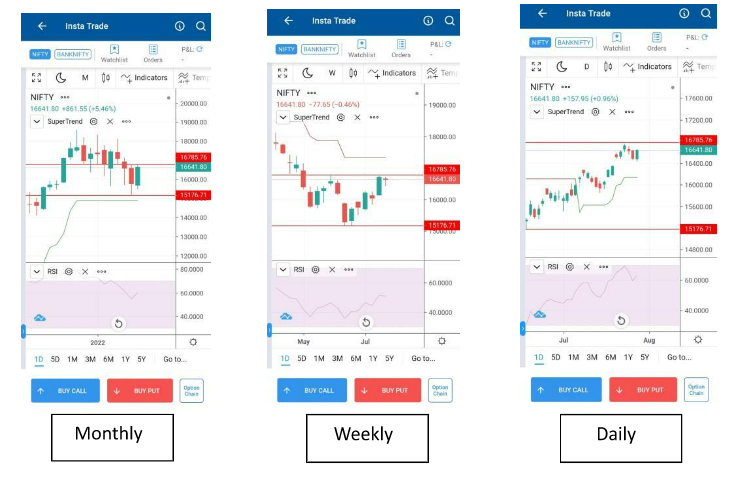
| Time Frame | Trend | CandleStick | RSI | Resistance | Support |
| Monthly | Bullish | Bullish | 60 (Neutral to Overbought) | 16800 | 15500 |
| Weekly | Bearish | Bullish | 51 (Neutral) | R1 -16800
R2 -17350 |
S1 – 16150
S2 – 15850 |
| Daily | Bullish | Neutral | 70 (Overbought) | R1 -16800
R2 -17000 |
S1 – 16500
S2 – 16350 |
Chart analysis indicates that 16800-17000 level will act as important resistance zone, also RSI at daily and hourly time frame is at Over Boought zone suggests that in near-term Nifty may not go up with same pace. It may retrace upto the point when RSI cools-off to the level of 40.
So we may see Nifty retracing upto the level of 16350-16500 level in coming week. Upside seems limited in coming week.
Follow-up
In line to our analysis, Nifty fell from the resistance zone of 16800 where RSI was at overbought zone of 70 on a daily timeframe.
Nifty gained support at 16450-500 level. Your strangle must have give you good returns this week.
Support & Resistance for today’s expiry .
Support : 16500
Resistance : 16750
Charts references :
The easiest Options trading platform! Get Charts, Watchlist, Positions & live P&L in single screen
Published on: Jul 27, 2022, 5:06 PM IST
We're Live on WhatsApp! Join our channel for market insights & updates

Get the link to download the App

