
Indian benchmark indices have staged a strong comeback from their intraday lows and were trading in positive territory during the afternoon session. A particularly noteworthy performer was the Nifty PSE Index, which was trading 2.8% higher and had reclaimed its significant psychological level of 10,000.
The index opened at 9,719.05 on Wednesday and reached an intraday low of 9,698.40. Since then, it has seen solid buying interest and was trading near its daily high and close to the previous session’s high.
On the daily chart, the Nifty PSE Index formed a candlestick pattern known as the Tweezer Bottom, which is typically a bullish reversal pattern observed after a downward correction. This pattern consists of two candles: the first is bearish, while the second is bullish, indicating that the price has nearly recouped the losses from the previous bearish candle.
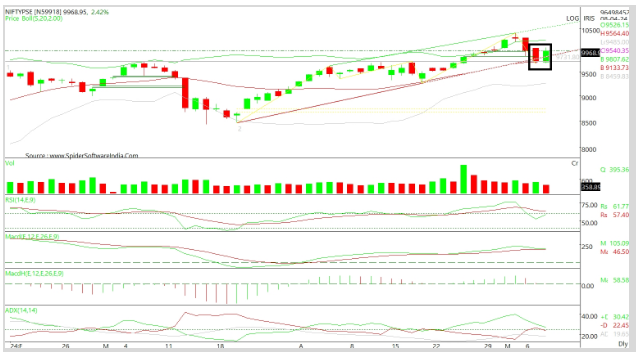
On Tuesday, the bearish candle had a low of 9,683.85, and on Wednesday, the low was 9,698.40, nearly identical, signaling a possible reversal. Additionally, this pattern formed around a significant moving average, the 20-day moving average (DMA), which also aligns with a key support area where the index has retested the boundary of an ascending triangle.
The Nifty PSE Index is currently trading above critical moving averages: the 20, 50, and 200-DMA. More significantly, all these moving averages are trending higher in the preferred sequence, indicating a sustained positive momentum. The daily MACD (Moving Average Convergence Divergence) has found support at its nine-period average, further validating the bullish sentiment.
So far in 2024, the index has delivered returns of nearly 27%, indicating a robust performance and a positive outlook for the rest of the year.
Disclaimer: This blog has been written exclusively for educational purposes. The securities mentioned are only examples and not recommendations. It is based on several secondary sources on the internet and is subject to changes. Please consult an expert before making related decisions.
Published on: May 8, 2024, 6:07 PM IST
We're Live on WhatsApp! Join our channel for market insights & updates

Get the link to download the App

