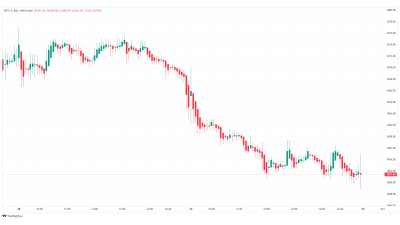
Short Term Traders trade on the basis of daily charts as they are more interested in the immediate movement in the stock prices, whereas Medium term to Long term Traders are more dependent on weekly / monthly charts as they want more returns for which they are prepared to wait for a longer duration.
Types of Charts
The primary chart types utilised by technical analysts include line charts, bar charts, candlestick charts, Renko charts, and Point-and-Figure charts. These charts can be displayed using either arithmetic or logarithmic scales, depending on the specific information that the analyst deems important and how effectively that information is conveyed.
Line Charts
Line charts represent the simplest form of charts, consisting of a single line that connects the closing prices from left to right. Typically, only the closing price is plotted, shown by a single point.
These charts are popular for presentations and reports to provide a broad overview of historical and current trends.
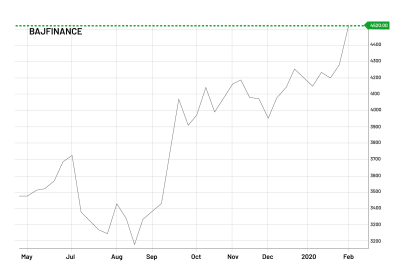
This method offers a clear and straightforward way to understand the general direction of price movements, preferred by some traders for its simplicity.
While line charts do not offer detailed insights into intraday price fluctuations, many traders prioritise the closing price over the open, high, or low prices within a given period.
Bar Charts
Bar charts, also known as open-high-low-close (OHLC) charts, are fundamental tools in technical analysis. They consist of a series of vertical lines that indicate the price range during a specific timeframe.
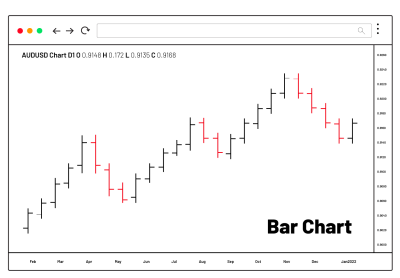
Bar charts help traders identify patterns by considering all price points: open, high, low, and close. The opening price is marked by a horizontal dash on the left side of the vertical line, while the closing price is on the right side. A rising period, where the opening price is lower than the closing price, is often represented by a black (or green) line, whereas a falling period is shown in red.
Candlestick Charts
Candlestick charts, a staple in technical analysis, feature a main component resembling a candlestick, with a thick 'body' and lines extending above and below, called the upper and lower shadows.
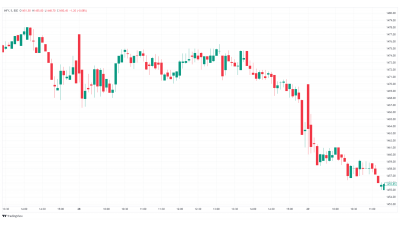
The top of the upper shadow indicates the high price, while the bottom of the lower shadow represents the low price. Patterns are identified based on both the real body and the shadows, especially over short periods. They often signal trend reversals at the top of an uptrend or the bottom of a downtrend.
The body of the candlestick represents the range between the opening and closing prices, coloured black/red for a lower close and white/green for a higher close. The thinner parts, or wicks/shadows, show the highest and lowest prices during that timeframe.
The relationship between the candlesticks’ bodies is crucial for pattern recognition. Although candlestick charts make spotting gaps between bodies easier, they take up more space than OHLC bars, limiting the amount of data displayed.
Renko Chart
Unlike other chart types, Renko charts focus solely on price movements, ignoring time and volume.
These charts feature white/green and black/red bricks, added based on whether the price rose or fell compared to the previous brick, determined by a set brick size. White/green bricks signify price increases, while black/red bricks indicate decreases.
New bricks are added based on volatility criteria, which can be either an advantage or disadvantage. They may appear in minutes or take over a day, depending on market conditions. This method helps traders identify supports, resistances, and trends but can obscure market sentiment and render other analysis tools less effective.
Heikin Ashi
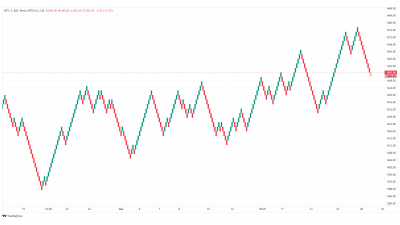
Originating from Japan, Heikin Ashi charts resemble candlestick charts, with the colour indicating price direction.
Heikin Ashi charts highlight uptrends and downtrends more clearly. A strong uptrend is indicated by consecutive green HA candles without lower shadows and a strong downtrend by consecutive red HA candles without upper shadows.
The key difference from candlestick charts is that HA charts average price movements, creating a smoother appearance and not showing exact open and close prices for a period.
Heikin Ashi charts are used independently by swing traders and investors, while day traders often use them as an additional indicator.
Tell me something about the Chart Construction for Technical Research
The X-axis on a chart plots the periods for which prices are plotted and the Y-axis plots the value or the price of the share. This could range from a few hours to a few years. This means that prices can be plotted based on the prices that range from hours to years. Thus we could have minute charts as well as hourly, daily, weekly, monthly, quarterly, yearly charts based on the above data.
The 4 quotes are normally in the order of-
- Open
- High
- Low
- Close
Let us see how a Bar chart and Candlestick chart is constructed with the help of the following illustration.
Script A:-
| Opening Price on a day | ₹150 |
| High price of the day | ₹160 |
| Low price of the day | ₹125 |
| Closing price of the day | ₹130 |
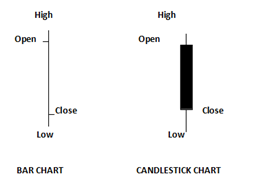
In a Bar chart, the open is indicated by a small dash ( – ), which is drawn on the left side of the Bar, and the close by another dash on the right side of the bar. In a Candlestick chart, the real body, i.e. the 2 ends of the body, show the opening and the closing price for the given period. The lines at the top and bottom of the real body are called the shadows, denoting the high and the low for that session. The colour of the body denotes the opening and closing of that session. If the open-to-close is on the higher side, i.e., a bullish candle, the candle's colour is white, and if it is bearish, then the candle's colour is black. Some packages use green and red instead of white and black.
Wrapping Up
Different chart types like line charts, bar charts, candlestick charts, Renko charts, and Heikin Ashi charts each offer unique ways to analyse stock prices. Line charts give a simple view of trends, while bar and candlestick charts show more details. Renko charts filter out noise, and Heikin Ashi charts clearly show trends. Learning how to read these charts helps you make smarter trading decisions. Whether you're looking at daily moves or long-term trends, these tools can help.
Start investing smarter with Angel One. Sign up now and boost your investment journey!
