
KPR Mills, one of the largest vertically integrated apparel manufacturing companies, is currently trading near its all-time high and appears to have the potential for a breakout. Consider adding this stock to your watchlist, as it exhibits a rounding bottom pattern with multiple chart pattern breakouts on both weekly and daily charts. Here is the story of KPR Mill’s charts.
Stock Performance:
KPR Mills has demonstrated strong price performance across multiple timeframes, indicating a bullish trend. In the short term, the stock has surged by 4.24% in the past week, suggesting a potential near-term uptrend. The one-month performance, with a gain of 10.17%, suggests sustained buying interest, while the three-month gain of 29.49% demonstrates robust momentum.
Year-to-date, KPR Mills has significantly outperformed, with an impressive increase of 60.56%. Additionally, the one-year and three-year returns of 55.86% and 461.37%, respectively, highlight the stock’s remarkable long-term growth potential. These numbers, combined with positive technical indicators, indicate that KPR Mills is currently in an uptrend and may be an attractive choice for traders seeking momentum opportunities.
Technical Analysis Story
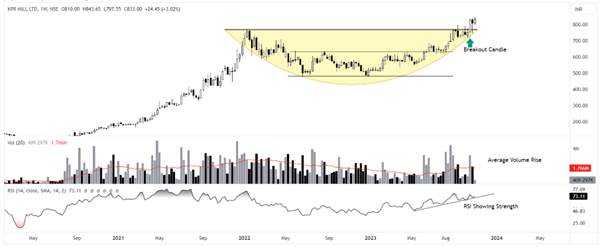
The chart of KPR Mills Ltd above displays a bullish momentum with a breakout on the weekly chart. Previously, the stock reached its all-time high in January 2022, after which the price experienced a 37% drop and entered a consolidation phase. In June, the stock’s price initiated a bullish momentum and formed a rounding bottom breakout in the third week of October. This breakout is supported by a strong Relative Strength Index (RSI) around the mark of 73, and the average volumes have increased compared to May and June, as clearly visible in the chart.
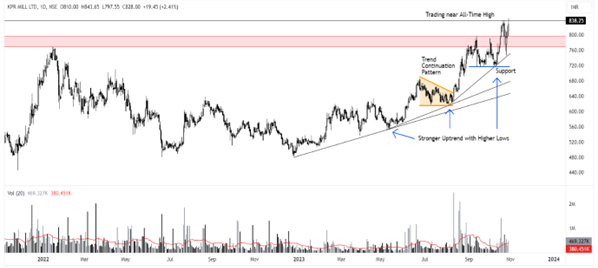
Furthermore, the stock’s price movement on the daily chart indicates that it is currently trading near its all-time high. The rally began in the last week of December 2022, gained strength, and confirmed super bullishness after breaking a flag pattern in August 2023. The stock’s price consolidated near the all-time high and, on a day of higher volumes, managed to break those levels with a multi-year breakout. The trendlines shown in the above charts have not been revisited, as the stock is in a strong momentum, forming new higher highs and higher lows.
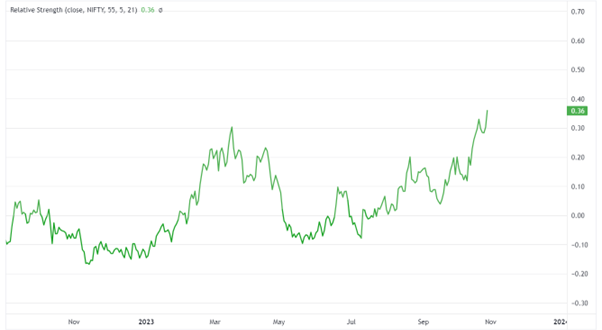
The chart depicting the Relative Strength of KPR Mills compared to the Nifty 50 index looks promising and suggests strong returns. The stock has outperformed the top 50 index, demonstrating its individual strength against some of the strongest listed companies in India in terms of price.
Fundamental Snapshot
K.P.R. Mill is engaged in one of the largest vertically integrated apparel manufacturing companies in India. The company produces yarn, knitted fabric, readymade garments, and wind power.
| Market Cap | 28,470 Crores | Face Value | Rs. 1.00 | Current ratio | 2.15x | |
| Current Price | Rs. 833 | Sales growth 3 Years | 22.60% | Quick ratio | 0.72x | |
| High / Low | Rs. 843 / 479 | Sales growth | 12.80% | Int Coverage | 13.3x | |
| Stock P/E | 36x | Debt to equity | 0.36x | Sales Var 10 Years | 14.00% | |
| Book Value | Rs. 108 | Price to book value | 7.68x | OPM 1 0Year | 20.30% | |
| Dividend Yield | 0.49% | Industry PE | 30.8x | No. Eq. Shares | 34.2 Crores | |
| ROCE | 24.40% | Promoter holding | 73.80% | Dividend Pay-out | 9.03% | |
| ROE | 23.40% | Profit after tax | Rs. 790 Cr. | Pledged percentage | 0.00% | |
| CF Operations | Rs. 299 Cr. | Intrinsic Value | Rs. 368 | PEG Ratio | 1.58x | |
Disclaimer: This blog has been written exclusively for educational purposes. The securities mentioned are only examples and not recommendations. It is based on several secondary sources on the internet and is subject to changes. Please consult an expert before making related decisions.
Published on: Oct 30, 2023, 5:19 PM IST
We're Live on WhatsApp! Join our channel for market insights & updates

Get the link to download the App

