Trendline trading is a fundamental technique in technical analysis used to identify the direction of price movements in a market. By drawing lines on a price chart, traders can understand trends and spot possible entry or exit points. It helps traders read market behaviour, but it should be used carefully along with other tools for better decision-making.
Key Takeaways
-
Trendlines help identify price direction by connecting support, resistance, highs, or lows.
-
They can be used across different timeframes and markets for basic trend analysis.
-
Breakouts and confirmations can guide trading decisions, but false signals are possible.
-
Trendlines often require periodic adjustments as new price data emerges. and should be combined with other tools.
What is a Trendline?
Trendlines are straight lines drawn on charts connecting a series of highs or lows (or support/resistance levels) to indicate potential price direction. The trader can then utilise the resulting line to get a solid indication of the potential direction of an investment's value movement. The trendlines are drawn by key support and resistance levels or higher highs and lower lows.
What is The Use of The Trendline?
When it comes to trading and investing, the first and foremost step is to identify the trend. Trading in the direction of the trend often improves risk-reward ratios, but it does not guarantee outcomes.
Trendlines are very important when it comes to technical analysis. While two points are enough to draw a trendline, using three or more points can make it more reliable. The trendline can be drawn on any timeframe and this quality makes the trendline a universal tool.
How To Access the Trendline Tool?
On most charting platforms, the Trendline tool is available in the drawing tools panel, though its position and shortcuts may vary. Look at the picture attached below for a better understanding.
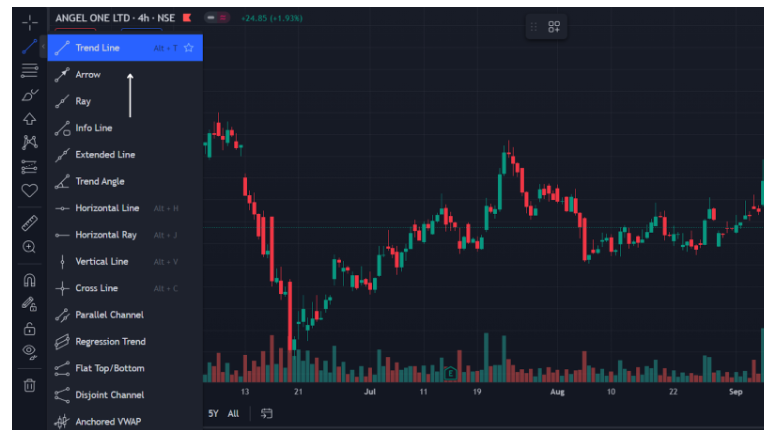
Now that we have understood the meaning and how to access the Trendline, let’s move on to how to use Trendlines. Once you have accessed the Trendline tool, you need to look for multiple support/resistance or higher highs/lower lows for a stronger confirmation.
Start drawing a trendline from the first point, connecting the second one all the way to the third point. This helps in identifying the trend for that timeframe. Now extend the Trendline from the third point to some extent and wait for the price to come near the drawn trendline.
If there is any bullish candle pattern or any other bullish sign formed, a buy position may be considered once it’s confirmed with his/her other tools in the trading set-up.
Similarly, if there is any bearish candle pattern or any other bearish sign formed, a sell position may be considered once it’s confirmed with his/her other tools in the trading set-up. Refer to the pictures attached below for a better understanding.
Read About: 10 Candlestick Patterns in Stock Market
What Are The Types Of Trendlines In Trading?
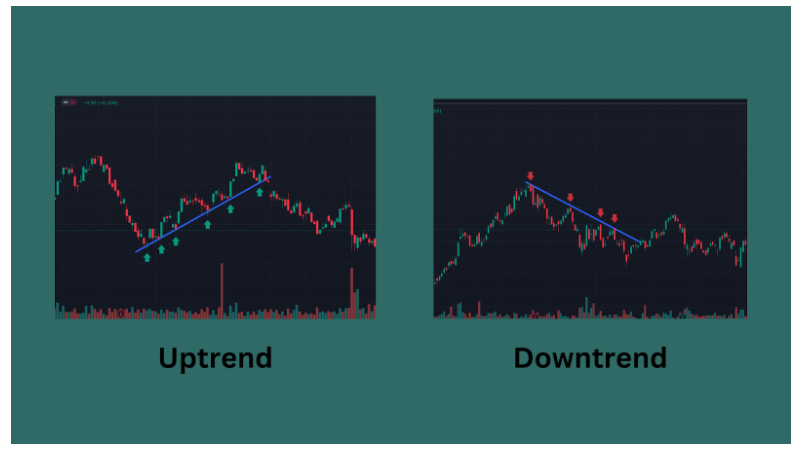
In trendline trading, traders generally use three main types of trendlines to understand price direction:
-
Up trendline: This line is drawn by connecting higher lows in a rising market. It reflects an upward price movement and often acts as a support level.
-
Down trendline: This line connects lower highs in a falling market. It shows a downward trend and usually works as a resistance level.
-
Horizontal trendline: This is drawn across a price level where the market repeatedly stops or reverses. It represents important support or resistance zones.
Using these trendlines together can help traders better understand market structure and identify possible entry and exit points.
Breakout Trading With Trendlines
Breakout trading using trendlines involves determining when the price crosses a trendline or a consolidation range. It helps to highlight a likely shift in the current price trend.
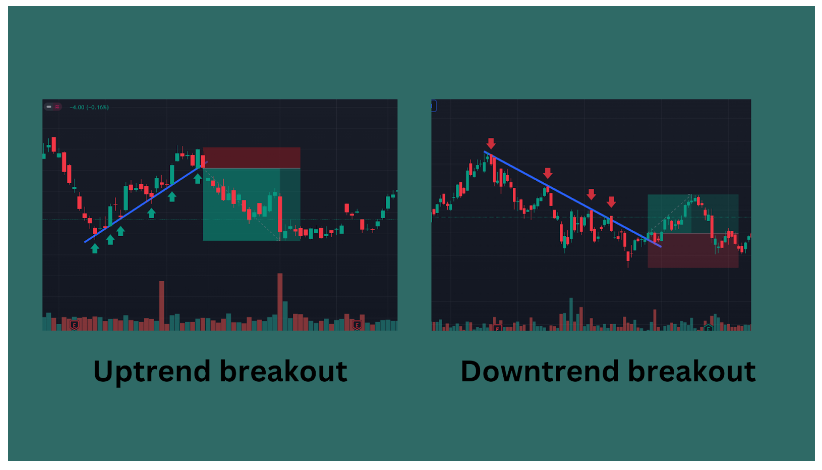
A breakout above resistance or a downward trendline may indicate a buy opportunity, while a breakdown below support or an upward trendline may indicate a sell opportunity.
However, trendline breakouts are not always reliable since short-term price swings can cause false breakouts. Using extra technical indicators or confirmation signals might help investors analyse such moves more accurately.
Read about: Top 5 Trend Indicators
How Can Trendline Trading Help in Stock Market Investment?
In stock market investing, understanding how to use trendlines can improve decision-making and risk management. Trendline trading helps in the following ways:
-
Understand price direction: By observing the trend, traders can get a clearer idea of whether the market is moving upward, downward, or sideways.
-
Manage risk with stop-loss: Trendlines can be used to place stop-loss levels near support or resistance, helping to control potential losses.
-
Recognise strong trends: A consistent trendline often indicates a stable trend, which can help traders decide when to enter or exit a trade.
By using trendline analysis as part of an overall strategy, traders can make more structured and informed investment decisions.
Can Trendline Trading Be Used In All Types Of Markets?
Trendline trading is a flexible method that can be applied across different financial markets. It helps traders analyse price trends and make more informed decisions based on market behaviour.
-
Stock market: Trendlines are commonly used to study price movements and identify trends, making it easier to plan entry and exit points.
-
Forex: In currency markets, trendlines assist in tracking price direction and marking important support and resistance levels.
-
Commodities and cryptocurrencies: These markets also use trendlines to understand price patterns and anticipate possible movements.
By applying trendline trading across various markets, traders can adapt their approach and improve their overall analysis.
Limitations of Trendlines
Although Trendlines are one of the most used tools when it comes to charting, they come with their respective limitations:
-
The major limitation is that one needs to re-adjust the trendline as more data come in. An investor cannot solely rely on the trend line drawn. A new higher high or lower low may require readjustment.
-
There can be confusion about whether to draw the Trendline using the candle's closing price or its highs/lows.
-
The third limitation is the use of smaller time frames. Trendlines drawn on smaller time frames tend to break very frequently due to greater price noise and short-term volatility, making them less reliable than those drawn on higher time frames. Additionally, trendline touches accompanied by higher trading volume are generally considered more significant, though volume alone does not guarantee trendline strength.
Conclusion
Trendline trading is a simple yet effective way to understand market direction and price behaviour. It helps traders identify trends, plan entries and exits, and manage risk more clearly. However, since it is based on interpretation, it should not be used alone. Combining it with other tools can support more balanced and informed trading decisions.
