
On Friday, Nifty opened flat at 19745 and remained volatile throughout the session, before closing the day at 19674, down 68 points.
Talking about the Weekly chart, Nifty formed a sizable bearish candlestick pattern with a lower low and lower high formation, though the volume was less, indicating a sharp reversal pattern on the downside. Nifty fell 518 points or 2.57%, the biggest loss since February in percentage terms
Previous two opening down gaps remain unfilled after a few sessions of its formation and these gaps could be considered as a bearish breakaway and bearish runaway gaps respectively. This could mean more weakness for the markets ahead. That said, given that last week we saw a red close in all the trading sessions, there are chances a cool-off might be seen amid short-covering.
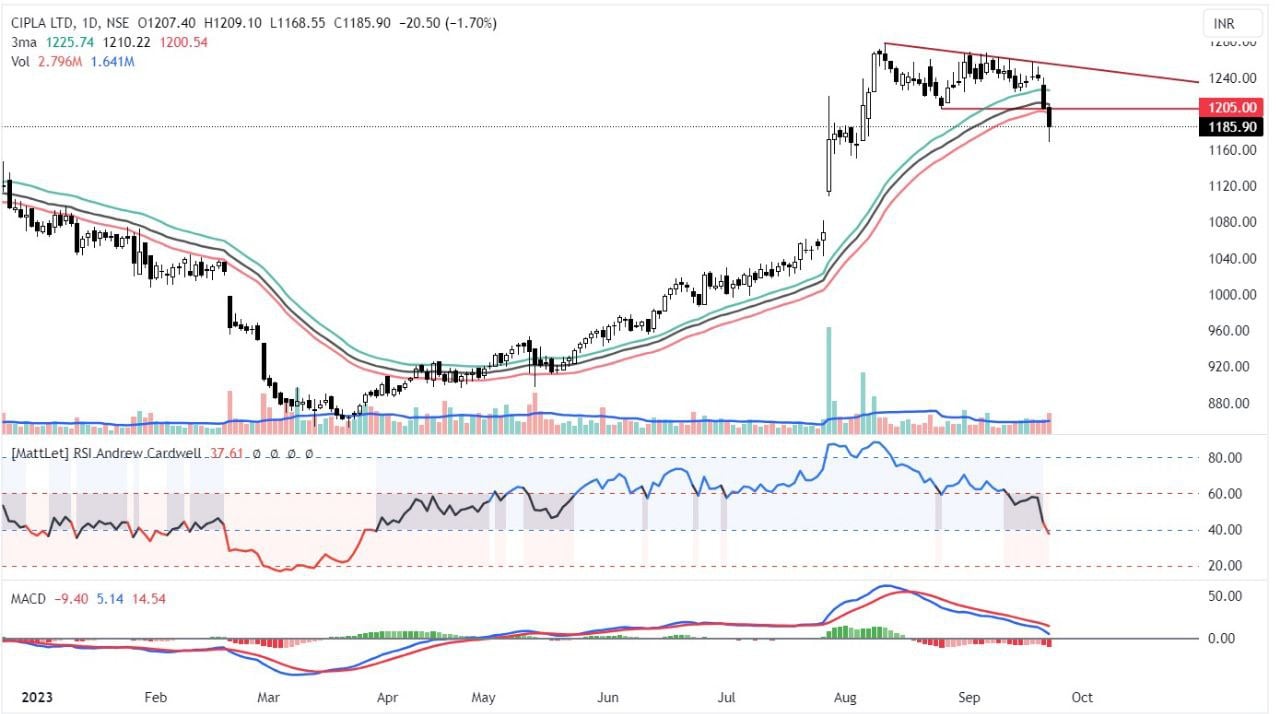
The cipla ltd stock has registered a descending triangle breakdown with above-average volume. The stock has rallied 50% prior to this breakdown. The stock closed below the moving average ribbon and all key moving averages. It closed per cent below the 50 DMA and below the 20DMA. The Bollinger bands began to expand, and indicating a possible impulsive move on the downside. The Elder’s impulse system has formed a strong bearish bar. The KST and the TSI indicators have given fresh bearish signals. In short, the stock has registered a bearish breakdown. A move below the level of Rs 1185 is negative, and the next support is seen at Rs 1155.
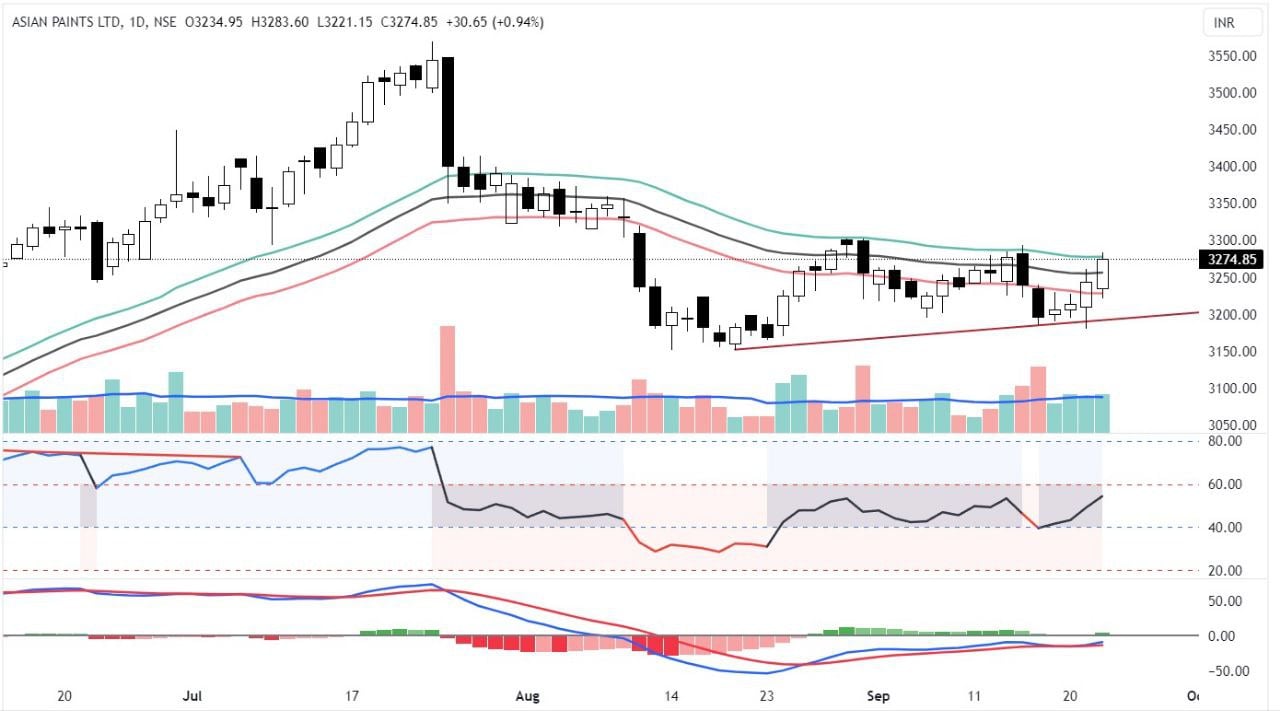
The asian paints stock has registered four successive positive closings when the broader market was deeply bearish. It closed at the moving ribbon resistance area. It decisively closed above the 20 DMA. The contraction in the Bollinger bands indicates a possible impulsive upside move. The MACD has given a fresh, bullish signal. The RSI is above the prior swing high and near the strong bullish zone. If the RSI moves above 60, We can see a strong bullish move. The Elder’s impulsive system has formed bullish bars. The KST and the TSI indicators are in a bullish set up. The stock also closed at the Anchored VWAP resistance. In short, the stock is ready to register a bullish pattern breakout. A move above Rs.3276 is positive, and the next resistance is placed at level of Rs.3305.
Disclaimer: This blog has been written exclusively for educational purposes. The securities mentioned are only examples and not recommendations. It is based on several secondary sources on the internet, and is subject to changes. Please consult an expert before making related decisions.
Published on: Sep 25, 2023, 8:59 AM IST
We're Live on WhatsApp! Join our channel for market insights & updates

Get the link to download the App

