
On Wednesday, the Nifty index closed above the 22,400 mark, but it fell nearly 72 points from its daily high, forming a small-bodied candle with an upper shadow. This indicates that although the Nifty closed in positive territory, it could not sustain higher levels, marking the third consecutive day of such performance.
The index is struggling to maintain momentum around the 61.8% retracement level of the previous decline. Additionally, the daily range has been less than 100 points for the last two days, suggesting diminished buying interest. Trading volumes have also been below average for the past three days. On the hourly chart, the MACD has given a new bearish signal, as anticipated. The daily RSI stands at 54.08, indicating a flattening momentum. Despite these bearish indicators, the Nifty remains above its key moving averages, including the 10-week average and the 50 DMA.
After the first hour of trading, the index formed lower high bars, mirroring the previous day’s price action, with gains limited to 0.15%. The index’s attempt to break above the 22,450-resistance failed, suggesting a lack of clear directional bias. Moreover, the Implied Volatility has dropped to 11.2, leading to cheaper option premiums, while India VIX is at 10.27, not ideal for a trending market.
The rollover rate is recorded at 49.44%, which is below the three-month average. This indicates that the current trend does not inspire confidence for rolling over positions. In these circumstances, it’s prudent to stay on the sidelines and await a clearer trend before committing to a particular strategy. For now, stock-specific action seems more viable.
The stock of NMDC surged over 5% on Wednesday, closing just 1% shy of its prior high. It has broken out of an 8-day flat base with higher volume, indicating a potential bullish trend. NMDC is trading above all its long-term moving averages, which are all showing an upward trend.
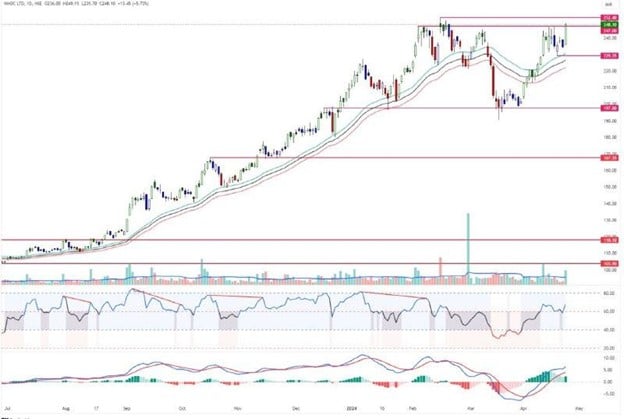
NMDC is currently 9.51% above its 50 DMA, with expanding Bollinger Bands and a moving average ribbon in an uptrend. The MACD is displaying strong bullish momentum, while the RSI, after finding support at 60, has bounced back, signaling a bullish move. The KST is also in a bullish mode, and the Stochastic RSI has given a fresh bullish signal.
With these positive indicators, NMDC’s breakout from the flat base suggests a potential upward move. A break above Rs. 250 could signal a test of Rs. 282. However, traders should maintain a stop loss at Rs. 240 to mitigate risk.
Disclaimer: This blog has been written exclusively for educational purposes. The securities mentioned are only examples and not recommendations. It is based on several secondary sources on the internet and is subject to changes. Please consult an expert before making related decisions.
Published on: Apr 25, 2024, 11:57 AM IST
We're Live on WhatsApp! Join our channel for market insights & updates

Get the link to download the App

