
The NSE benchmark Nifty 50 index opened the session with a negative bias. However, it quickly recovered from lower levels and surpassed the milestone of 23,000 for the first time in history. Despite this, it oscillated in a narrow range throughout the day, touching a fresh all-time high of 23,026.40.
On the daily chart, the index has formed a shooting star-like candlestick pattern. A shooting star candlestick pattern is a single bearish pattern that forms after an advance.
Conversely, on the weekly chart, the index has formed a strong bullish candle with higher highs and higher lows compared to its prior week’s candle. This suggests a continuation of buying interest in the index. Given the relevance of the higher timeframe (i.e., the weekly timeframe), there is no sign of worry for the bulls as of now. The shooting star formation can be considered routine profit booking after a six-day rally in the index. Moreover, on Thursday, the index price moved above the upper end of the Bollinger Band, suggesting that the price is likely to revert to within the Bollinger Band based on the assumption that prices tend to revert to the mean over time.
That said, the market breadth remained negative as declining stocks outnumbered advancing stocks for the second day in a row, which is a sign of caution.
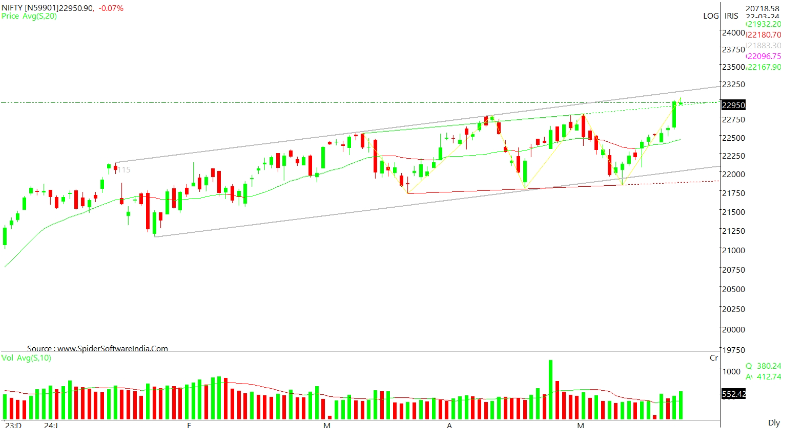
Technically, the Nifty 50 index trades within an ascending channel. The upper end of the channel is placed around the 23,170-23,200 mark, which is likely to act as a strong resistance in the immediate term. Meanwhile, on the downside, immediate support is placed at the 22,780-22,800 level.
Disclaimer: This blog has been written exclusively for educational purposes. The securities mentioned are only examples and not recommendations. It is based on several secondary sources on the internet and is subject to changes. Please consult an expert before making related decisions.
Published on: May 24, 2024, 6:49 PM IST
We're Live on WhatsApp! Join our channel for market insights & updates

Get the link to download the App

