
The NSE benchmark Nifty 50 index reached a fresh all-time high of 22,775.70 on April 10, 2024, and market participation ended the day on a cheerful note, only to return to a more disgruntled atmosphere as cues from global markets played spoilsport. As a result, markets opened lower on Friday. However, no one anticipated that by the end of the day, we would be closing near the 22,500 mark, down by 1.03%. This is what happens when sentiments run too high and reach an extreme; in this case, market participants were riding on waves of optimism.
On the daily chart, the index formed a bearish candle that managed to close near the day’s lows. With Friday’s sharp fall, the index filled the opening upside gap of April 08, 2024. Until Wednesday, the upward swing in Nifty had lasted for 13 days without the index closing below the prior low in this period, marking it as the most extended swing in recent times. However, with such a sharp fall and an increase in the daily range, it’s clear that bears have found their footing. Supporting this notion is the evidence of a reversal candlestick formation on the weekly chart, with the formation of a Shooting Star candlestick pattern on the weekly timeframe.
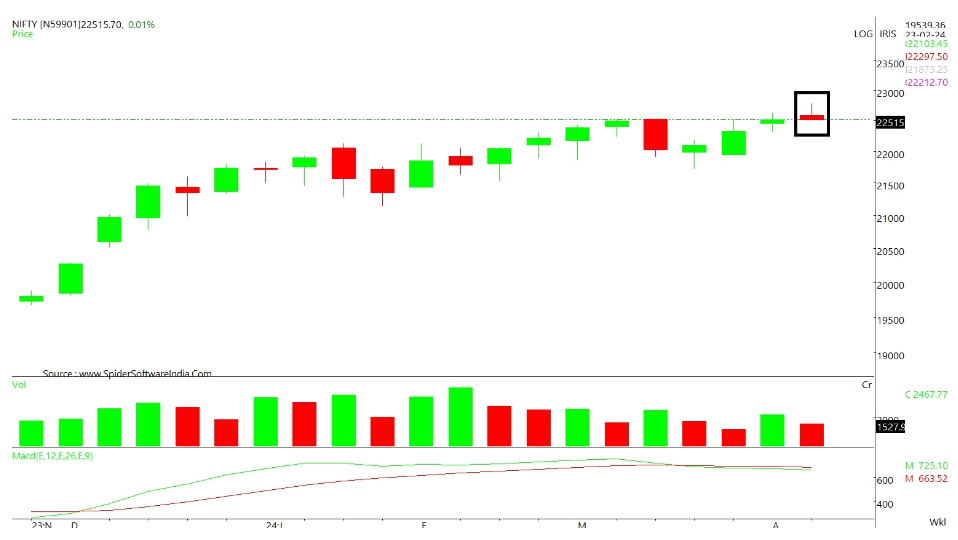
In the coming week, the low of 22,503.75 is an important level to watch out for, as sustaining below this level would be the first evidence confirming the bearish implication of the Shooting Star candlestick pattern. The index on its way down could test its 20-DMA, which currently stands at the 22,270 level. The 14-period daily RSI has slipped below the 60-mark and also below the 9-days average. Additionally, the +DI line has slipped below the level of 25 and is trending downwards, while the -DI has seen its trajectory shift upward. Hence, these are indications that it’s time to be cautious.
Interestingly, the Nifty 50 index faced strong resistance in the zone of 22,430-22,510, and only after multiple attempts did it manage to cross this resistance. Therefore, there is an anticipation that this support would hold based on the principle of polarity; once the resistance level is breached, it becomes a support level.
Disclaimer: This blog has been written exclusively for educational purposes. The securities mentioned are only examples and not recommendations. It is based on several secondary sources on the internet and is subject to changes. Please consult an expert before making related decisions.
Published on: Apr 12, 2024, 6:31 PM IST
We're Live on WhatsApp! Join our channel for market insights & updates

Get the link to download the App

