
Incorporated in 1995, Ind-Swift Laboratories Ltd (ISLL) is engaged in the manufacturing of Active Pharmaceutical Ingredients (API), advanced Intermediates, and providing Contract Research and Manufacturing Services (CRAMS). ISLL is a part of the Ind-Swift Group and was formed in 1995. The company has three manufacturing facilities—two in Dera Bassi (including a research facility), Punjab, and one in Samba, Jammu & Kashmir. The products manufactured by the company are sold in both India and the export markets.
The company successfully completed a slump sale transaction on March 18, 2024, and has repaid its entire external debt from the proceeds of the slump sale. Consequently, the company does not have any external debt obligations, and its liquidity position stands comfortable.
Technically, the stock of Ind-Swift Laboratories registered a fresh 52-week high on Monday. The stock made a high of Rs 132.95 and is currently trading with modest gains of 0.35% at Rs 128.70. Considering that the stock is trading near its 52-week high, it is trading above all its key moving averages. Interestingly, the stock has logged a breakout of a multi-year range. Since 2021, the stock has been facing strong resistance around the level of Rs 124-127. However, during the last week, the stock formed a sizable bullish candle and went past the resistance, backed by the highest weekly volume in history. Total weekly volume during the last week was four times greater than the 10-week average volume and eight times greater than the 30-week average volume.
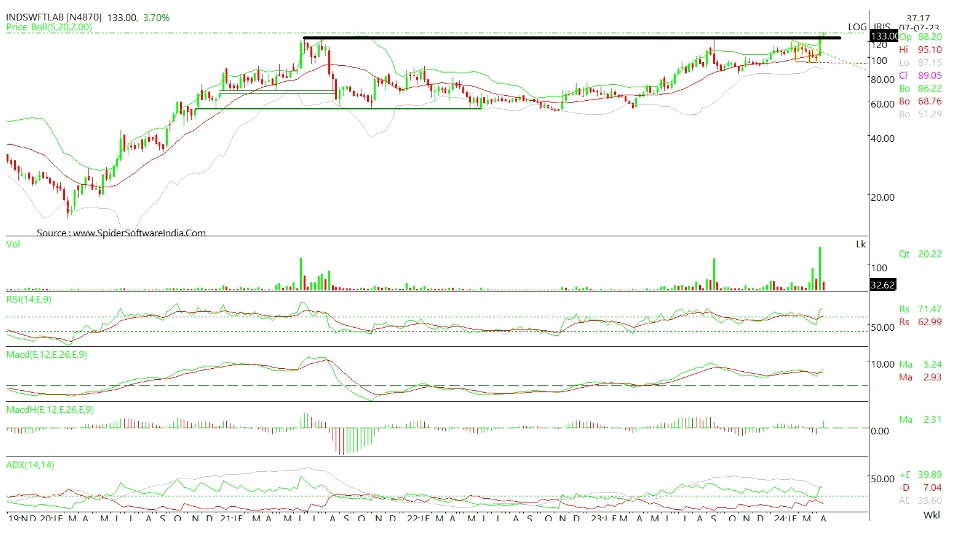
The daily MACD has generated a bullish crossover, thus validating a positive bias. The daily RSI has also generated a bullish crossover recently and is on a rising trajectory, thus validating a positive bias. The Average Directional Index (ADX), a trend strength indicator, stands at 36.4, indicating a strengthening trend with the ADX in an upward trajectory. Additionally, the positive directional indicator (+DI) is notably higher than the negative directional indicator (-DI), indicating bullish strength in the stock.
Disclaimer: This blog has been written exclusively for educational purposes. The securities mentioned are only examples and not recommendations. It is based on several secondary sources on the internet and is subject to changes. Please consult an expert before making related decisions.
Published on: Apr 8, 2024, 2:42 PM IST
We're Live on WhatsApp! Join our channel for market insights & updates

Get the link to download the App

