
The Bank Nifty, after experiencing a relatively quiet FY24, has commenced FY25 on a promising note. Demonstrating robust performance, it has outpaced the Nifty 50 index by a considerable margin, surging over 3.5% thus far in FY25. Notably, two significant constituents of the Bank Nifty are HDFC Bank and ICICI Bank, jointly constituting approximately 53% of the Bank Nifty’s weightage.
On Tuesday, ICICI Bank, commanding a weightage of 23.73%, exhibited an upward trajectory, recording a 2.5% gain. On the NSE, the stock initiated trading at Rs 1091.95 and established an intraday low of Rs 1088.30. However, as of the time of writing, it was observed trading near its daily high of Rs 1115 per share on the NSE.
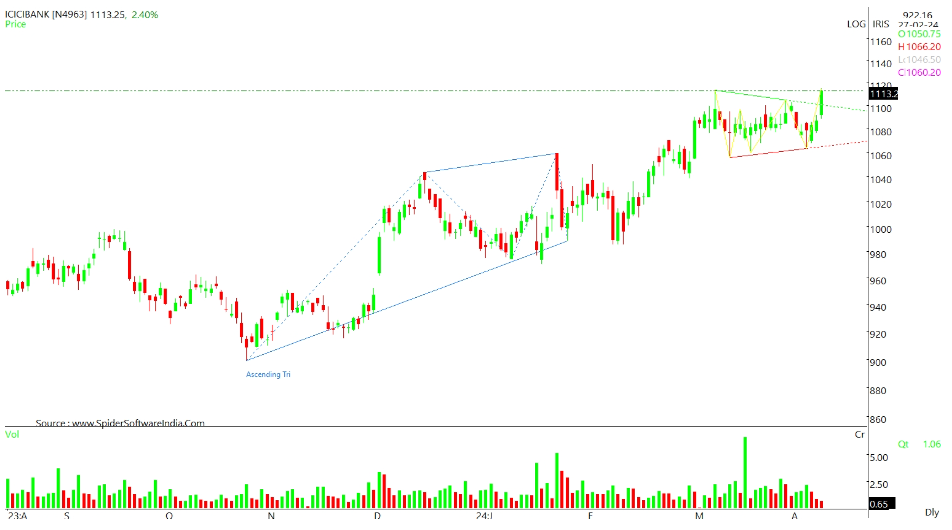
From a technical standpoint, ICICI Bank is positioned above all its key moving averages. Particularly noteworthy is the alignment of these moving averages in a favorable sequence, all trending upwards, which augurs well for the stock. Additionally, an intriguing observation lies in the stock’s rapid retracement. Despite a prior corrective decline from Rs 1105.05 to Rs 1063.45, amounting to nearly 3.76%, unfolding across four trading sessions, the stock has retraced this decline within just three trading sessions.
On the daily chart, the stock has exhibited a breakout from a one-month long triangular pattern, signifying strength. Further enhancing the bullish outlook, the Bollinger Bands have expanded post-breakout, following a squeeze, which is typically interpreted as a positive indicator for the stock. Moreover, the daily 14-period RSI has surged above the 60 level and continues to trend higher, marking a fresh swing high.
Turning to the options market, notable concentrations of open interest are observed at the 1100 CE strike price, trailed by the 1150 CE strike price. Conversely, on the put side, significant open interest accumulation is noted at the 1100 PE strike price, followed by the 1080 PE strike price. Noteworthy activity includes substantial open interest addition at the 1110 PE strike price, alongside significant unwinding at the 1100 CE strike price.
In conclusion, the technical analysis of ICICI Bank’s performance underscores its strength and potential for further upside, reflecting the positive momentum in the Bank Nifty at the onset of FY25.
Disclaimer: This blog has been written exclusively for educational purposes. The securities mentioned are only examples and not recommendations. It is based on several secondary sources on the internet and is subject to changes. Please consult an expert before making related decisions.
Published on: Apr 9, 2024, 1:46 PM IST
We're Live on WhatsApp! Join our channel for market insights & updates

Get the link to download the App

