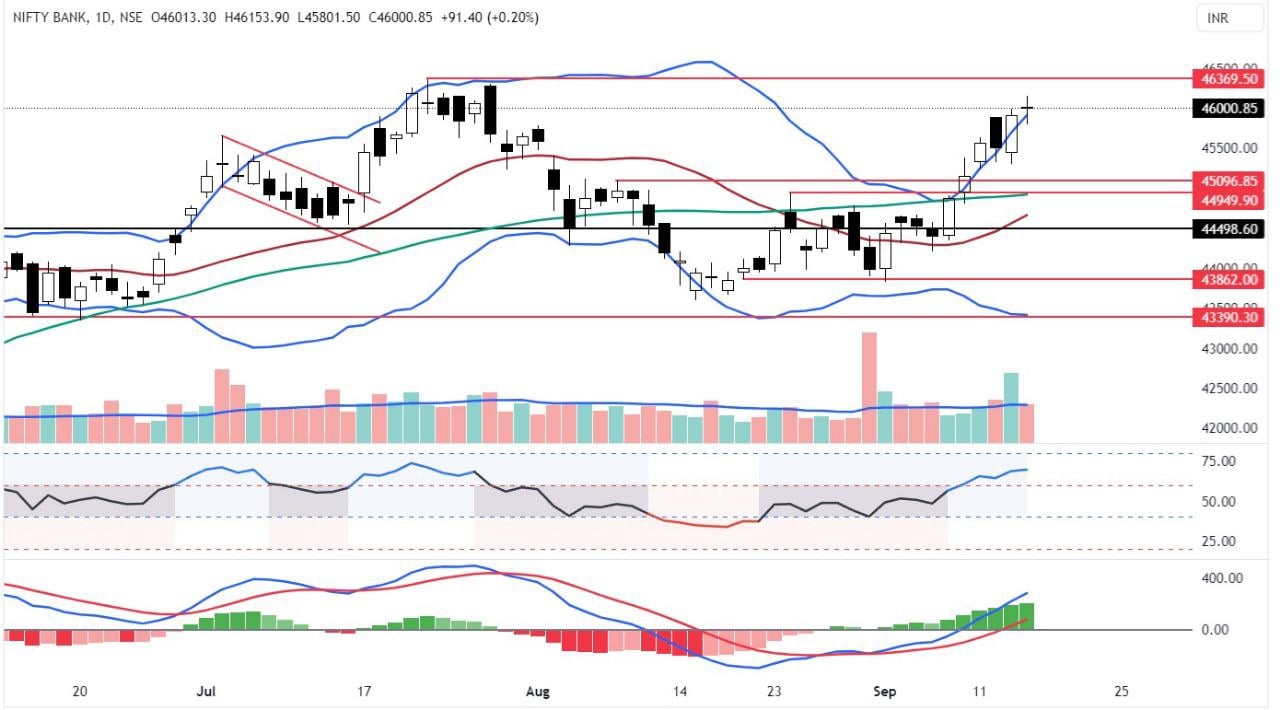
On Thursday, the Bank Nifty opened the session in positive territory and reached a high of 46,513.90. Afterward, the index traded within the range of the first 75-minute candle and formed a Doji candle on the daily chart because the open and close for the day were close in proximity. More importantly, the formation of the Doji candle occurred above the Bollinger Bands, indicating a potential counter-trend consolidation in the near term. The index closed above the previous day’s high, which is a positive factor. However, it trimmed its gains from the day’s high, clear evidence that market participants are hesitant to commit at higher levels.
The volume was below average, nearly 50% of the previous day’s volume. The RSI has flattened as the daily range is lower than the previous two days. The MACD indicates that momentum remains intact. In any case, if the index opens and closes negatively on Friday, it will signal a reversal and potential counter-trend consolidation. If it closes below the 45,920 level, a reversal is likely, with the next level of support seen at 45,300. On the upside, if the index sustains above the 46,200 mark, it would indicate a positive bias, and it may test or exceed the previous high of 46,370. The first hour’s range will provide us with the directional bias. Trade either side of the breakout for intraday gains.

The Bank Nifty ended Thursday’s session with a modest gain of 0.20% and formed an indecisive candle on low volume. Looking ahead, a move above the level of 46,200 is positive, and it could test the all-time high level of 46,369.50. Maintain a stop loss at 45,920. If it surpasses the level of 46,369.50, continue with a trailing stop loss. However, a move below the level of 45,920 would give bears an opportunity, potentially testing the level of 45,760 on the downside. Maintain a stop loss at 46,075.
Disclaimer: This blog has been written exclusively for educational purposes. The securities mentioned are only examples and not recommendations. It is based on several secondary sources on the internet, and is subject to changes. Please consult an expert before making related decisions.
Published on: Sep 15, 2023, 8:45 AM IST
We're Live on WhatsApp! Join our channel for market insights & updates
