
On Tuesday, the Bank Nifty formed a back-to-back “open=high” candle, indicating a negative trend. Since the closing price was lower than the opening level, it created a consecutive bearish candle on the daily chart. However, despite these bearish indicators, the index has maintained its pattern of higher highs and higher lows for the third consecutive day. This suggests that while there’s a downward bias, the overall trend is still upward.
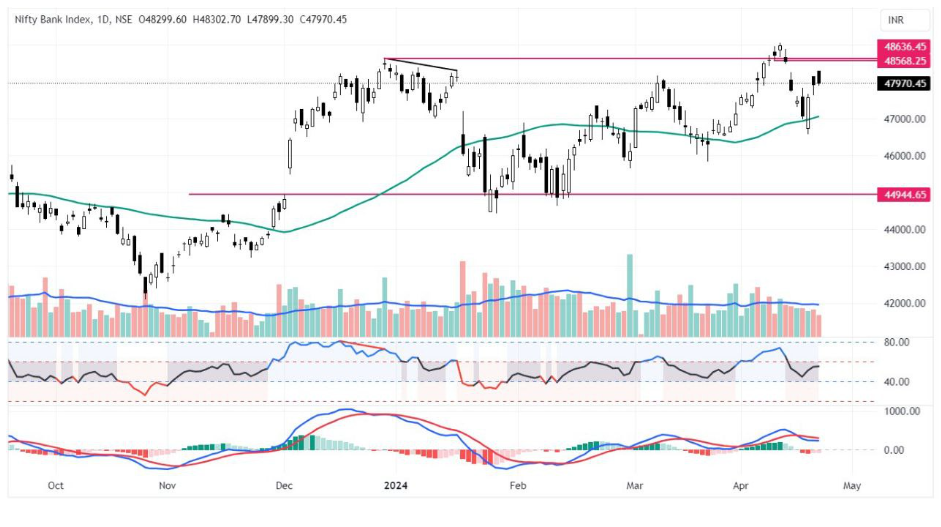
Although the index has shown gains over the past three days, it closed below the opening level in the last two, forming bearish candles. The volume during these sessions was significantly lower than the previous days, indicating reduced market activity. This declining volume pattern has persisted over the past week, which could be a sign of weakening momentum. Additionally, the opening downside gap area of April 15 is proving to be a stiff resistance point, limiting upward movement.
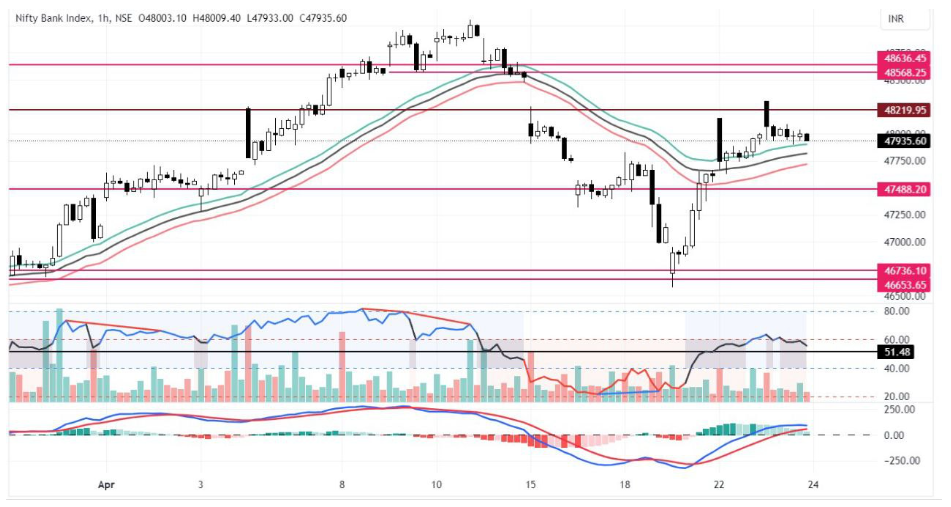
The contraction of the Bollinger Bands suggests limited upside potential, indicating a possible consolidation phase. The hourly chart reveals that the index has formed lower highs and closed below the first-hour low, which is another bearish sign. With the upcoming monthly expiry, market volatility is likely to increase, adding to the uncertainty. The hourly Moving Average Convergence Divergence (MACD) is also about to give a bearish signal, further reinforcing the negative sentiment.
If the index manages to fill the April 15 gap area by reaching 48,636, there could be additional upside potential. However, if it closes below the 20-day moving average (DMA) at 47,432, a further downward move is likely. The 50 DMA support is positioned at 46,886, serving as another critical level to monitor. Traders should also watch the rollovers for directional bias as they may indicate broader market trends.
Given the current market conditions, traders should approach the Bank Nifty with caution. Here’s a suggested strategy for navigating this environment:
These levels and signals are critical for making informed trading decisions in a volatile market. Stay vigilant and adapt your strategy as market conditions evolve.
Disclaimer: This blog has been written exclusively for educational purposes. The securities mentioned are only examples and not recommendations. It is based on several secondary sources on the internet and is subject to changes. Please consult an expert before making related decisions.
Published on: Apr 24, 2024, 10:15 AM IST
We're Live on WhatsApp! Join our channel for market insights & updates

Get the link to download the App

