
On Friday, the Bank Nifty opened at 48,660 and reached an intraday high of 48,679.65. However, the index failed to maintain these gains due to profit-taking, leading to a decline that ended the day down by 0.61%.
On the daily chart, Bank Nifty formed a “dark cloud cover” pattern, indicating potential bearishness. Despite Friday’s drop, the weekly chart showed an increase of 1.32%, but it formed a long-legged doji-like candle, suggesting indecision. This mixed signal indicates that the index might not be poised for a bullish trend.
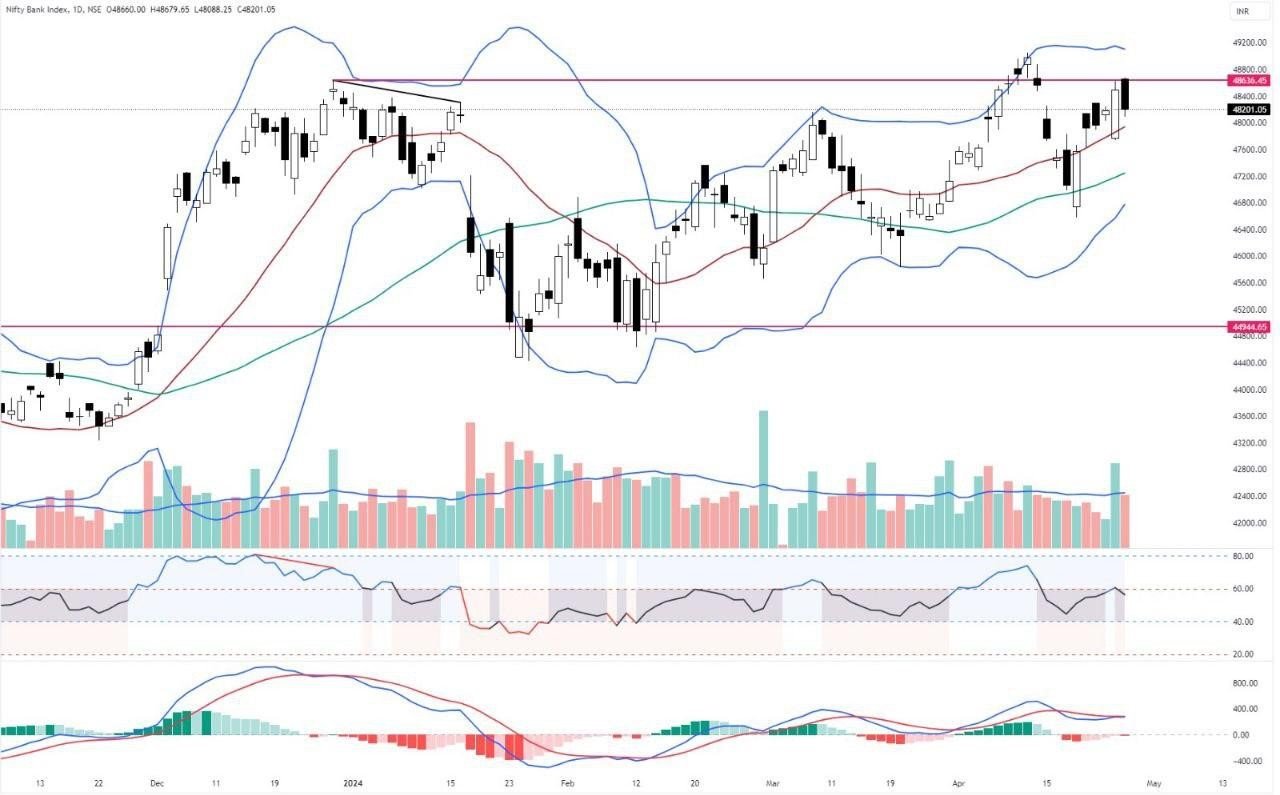
Throughout the week, the index displayed erratic behavior by forming two open-high candles, an inside bar, an outside bar, and a dark cloud cover. This erratic activity triggered stop-loss orders on both sides, contributing to increased volatility.
Within the Bank Nifty, different trends emerged across sectors. IndusInd Bank and Kotak Bank exhibited long-term breakdowns, while Public Sector Banks (PSU), led by SBI, contributed most of the gains. HDFC Bank also showed signs of technical weakness. The index found support at the 8-day exponential moving average (EMA). The relative strength index (RSI) faced resistance at the 60-zone. The moving average convergence divergence (MACD) was negative, and the Elder Impulse System produced a strong bearish bar.
Given the mixed signals, watch for the following key levels:
A move above 48,527 could lead to a new all-time high.
If the index falls below 48,183, the next strong support is at the 20-day moving average (DMA) of 47,937.
Expect more volatile days ahead and exercise caution when trading. It is recommended to trade with smaller quantities in both index and banking stocks.
For the trading day on April 29, the following strategy applies:
A move above 48,228 is a positive signal, potentially leading to a test of 48,563. In this case, maintain a stop loss at 48,110. If the index surpasses 48,563, continue with a trailing stop loss.
If the index falls below 48,110, it can further drop to 47,855. Maintain a stop loss at 48,230 in this scenario. If it falls below 47,855, use a trailing stop loss to manage your trades.
Overall, remain cautious and be prepared for more volatility in the coming days.
Disclaimer: This blog has been written exclusively for educational purposes. The securities mentioned are only examples and not recommendations. It is based on several secondary sources on the internet and is subject to changes. Please consult an expert before making related decisions.
Published on: Apr 29, 2024, 10:09 AM IST
We're Live on WhatsApp! Join our channel for market insights & updates

Get the link to download the App

