
Mutual Funds are one of the most preferred investment instruments. The two most common phrases that depict mutual funds create the essence of it, i.e “Mutual Fund Sahi Hai” and “Mutual Fund investments are subject to market risks”. It means that Mutual funds are both a great investment option and come with a certain amount of risk
Most investors are risk-averse, which means they want to avoid a loss of capital on their investment. For this purpose, there are certain measures that investors can apply to derive the risk level of a certain mutual fund.
Also Read More About What is Mutual Fund?
By applying these strategies, investors are able to take a calculated risk and thus maximize the return on investment.
However, all the theoretical ways and formulas can only predict risk in a Mutual Fund, not accurately measure it.
In this post, we will:
The Mutual Funds Industry in India has witnessed tremendous growth in the past few decades. The total Assets Under Management (AUM) in the MF sector stood at approximately Rs.33 cr. on May 2021.
The sector has witnessed a surge of more than 2 times in the last 5 years. Earlier, the average Indian investor was skeptical of investing in this arena because of the risk in Mutual funds. However, increased awareness and returns have inclined people towards it.
Below given is a graph that depicts the YoY growth in the Indian Mutual Fund sector.
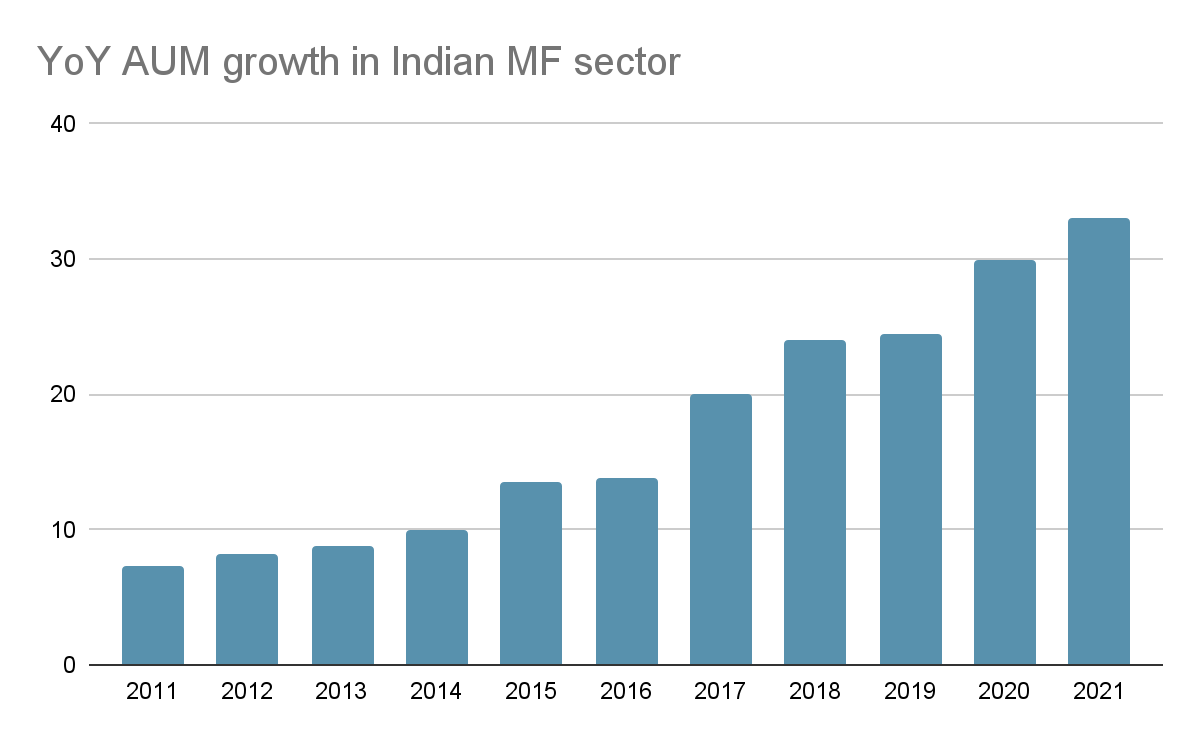
As we can see, the Mutual Fund industry has observed a consistent increase in the Assets Under Management for the last 10 years.
Investors minimize risk by putting their money into Mutual funds of different kinds. For instance, a portfolio of a semi-conservative investor may include some ETFs for high return, some income funds for stability, and some liquid funds for emergency use.
Let’s understand how a newbie investor can choose the right mutual fund based on their risk appetite.
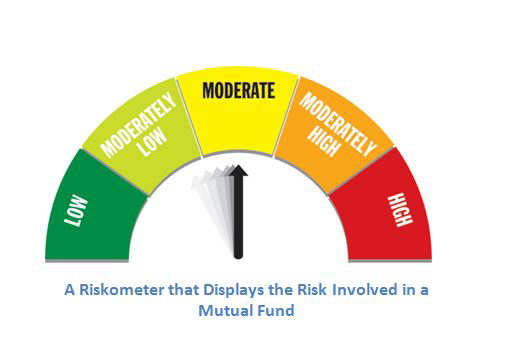
The Securities Exchange Of India (SEBI) has categorized the risk in various MF schemes in the five colors of the riskometer. It helps new investors understand the extent of capital loss in every scheme and thus choose the right fund according to their unique goals.
They can be classified as:
MF schemes like fixed maturity plans, income funds, and gilt funds come under the low-level risk category. They offer a stable rate of return on investments, minimizing market volatility.
Such funds are suitable for people looking for highly conservative investors who are willing to accept less return owing to less risk in the market. People nearing retirement often prefer these funds.
They consist of short-to-medium-term investment schemes, i.e a span of 1 to 3 years. Such investments are considered relatively safe and offer a higher return than low-risk Mutual Funds.
The instruments in this category have a moderate amount of risk in return for moderate returns. It includes arbitrage and hybrid debt-oriented funds and is suited for semi-conservative investors.
Balanced Equity funds, diversified equity funds, Gold ETFs, and Index funds are usually included in moderately high-risk level funds. They are long-term schemes with high return potential.
These schemes are suitable for a person looking to stay invested for 5-10 years in the market.
Finally, high-risk level funds are the ones that offer the highest rate of return on investment and are suitable for people with a high-risk appetite. Sectoral funds, Thematic funds, Micro-cap funds, and international funds are some categories under this risk level.
People who choose these schemes are willing to accept market volatility for high rewards.
Now that we understand the different levels of risk in Mutual Funds, the question arises that how are these risks determined? How does a fund manager know which fund is on what level of risk? How is it calculated? Let’s talk technicals.
There are six key indicators of risk in mutual funds. Five of them belong to the Modern Portfolio Theory (MPT) and one from the Post-Modern Portfolio Theory (PMPT). Let’s get an insight into the two and understand how to employ the methods given in them to derive risk in Mutual Funds.
Pioneered by Harry Markowitz, MPT talks about minimizing market risk for the conservative investor using diversification of asset classes.
The theory says that the return on investment should not be viewed from the returns by one asset class but rather should be viewed as a whole return by all products in the portfolio.
For instance, an investor buys shares of both the agriculture and oil sector. Due to some agreement between the government and the OPEC countries, the Oil import decreases leading to a hike in the share prices of the oil sector. On the other hand, a flood caused damage to agriculture and a subsequent decrease in the agriculture share prices took place.
Now, according to the MPT, the value of the overall portfolio will remain almost balanced because the hike in prices will cover up for the loss. Mr. Markowitz received a Nobel prize for his work on this theory.
The methods given in the MPT to measure risk in mutual funds use historical data to predict the upcoming returns. Let’s understand how.
The term Alpha is typically used for a dominating entity over the other. In Mutual Fund risk calculation, it is the percentage by which a fund exceeds the index’s returns.
Simply put, it shows how much better a fund performed against its benchmark index. For instance, if Sensex delivered a 15% return in the last financial year, and the HDFC index fund, a part of the Sensex index delivered an 18% return, the alpha of the HDFC fund will be 3%.
The higher the alpha of a fund, the greater is the growth potential.
The Beta method uses comparative analyses between a fund’s performance and its benchmark index to derive the risk percentage of a particular Mutual fund.
This method derives the relative riskiness of an asset instead of the inherent risk of that asset. The default Beta in the stock market is always the number 1. If a mutual fund’s Beta is 1, it means that it is running in line with its benchmark index.
A negative beta denotes less change in the price of an MF when the index returns fluctuate.
For instance, if the returns from the Nifty 50 index fell by 2%, a fund with 1 beta will likely fall by 1% only.
However, it is important to note that both alpha and Beta methods of calculating risk depend on market prices that keep on changing.
This method analyses a fund’s performance against its benchmark performance on a scale of 100. So if a Fund has 100 R-squared, it means it is in perfect correlation with its benchmark.
Most Mutual Funds in the Indian space have an R-squared of 80 or above. Below this number, the fund will not perform as a part of its index.
Funds with very high R-squared values are formed like an index and also start acting like one. For instance, Aditya Birla Sun Life Frontline Equity Fund moved in close correlation to its benchmark in the last 8 quarters and thus has a surprisingly good R-squared value of 99.
ABS Frontline Equity Fund returns Vs Nifty 50 TRI returns
| Quarter Ending | ABS Frontline Equity Fund returns(%) | Nifty50 TRI returns
(%) |
| June 19 | 0.5 | 2.0 |
| Sept 19 | -2.7 | -3.8 |
| Dec 19 | 5.6 | 7.4 |
| Mar 20 | -29.0 | -32.0 |
| June 20 | 19.6 | 26.6 |
| Sept 20 | 8.7 | 9.9 |
| Dec 20 | 24.5 | 22.8 |
| Mar 21 | 5.8 | 9.9 |
| R Squared | 99 |
While making an investment, if the R-squared value of a fund is very high, the investor can switch to the index fund. This way he will be able to enjoy the return on investment without having to pay the additional expense ratio.
The standard deviation depicts the change in the Net Asset Value (NAV) of a Mutual Fund against its average performance.
For instance, a fund gives an average annual return of 5%. Due to favorable conditions, it moved up to 8% in one financial year and fell to 4% in another. It shows a high deviation from its mean and thus, greater volatility in the fund performance.
If you are a conservative investor, you should choose funds with a low standard deviation that offers high predictability of returns.
This method calculates the risk-adjusted performance of a fund. It subtracts the risk-free rate of return from the overall return and divides the result by the Standard deviation of that fund.
There are mainly two reasons a fund might surge: proper management by the fund manager or high risk-taking. The Sharpe ratio is very useful for investors to understand the source of an MF’s high rate of return in order to make informed investment decisions.
Oftentimes, investors confuse high returns with the good performance of the fund. It is, in fact, not true in most cases. Let’s understand this with an example. There are two funds, A and B with an average return of 15% and 12% respectively. Let us derive the Sharpe ratio of the two funds.
| Fund A | Fund B | |
| Rate of Return | 15% | 12% |
| Risk-free return | 5% | 5% |
| Standard Deviation | 11 | 6 |
| Sharpe ratio | 0.91 | 1.17 |
As we can see, the return of Fund A is higher than Fund B, but the Sharpe ratio of the latter is still more. It means that Fund B is giving better, risk-adjusted results.
Post-Modern Portfolio Theory
The Post-modern portfolio theory argues comparing a fund’s performance with its benchmark isn’t as effective for a conservative investor as measuring the downside risk. The downside risk is the maximum level of capital loss a security can potentially incur.
Thus, to find out the risk in MFs, PMPT utilizes the Sortino ratio. Let’s understand what it is and how it minimizes risk.
The Sortino ratio of deriving risk is similar to the Sharpe ratio of the MPT theory. In both the formulas, the risk-free return is subtracted from the total return. However, instead of dividing the result with the standard deviation, the Sortino ratio divides the result from only the negative deviation in the value of a security.
For instance, let’s see how Fund A and fund B with a negative deviation i.e a loss potential of 7% and 8% respectively will behave in our earlier example.
| Fund A | Fund B | |
| Fund Returns | 15% | 12% |
| Risk-free return | 5% | 5% |
| Negative Deviation | 7% | 8% |
| Sortino Ratio | 1.43 | 0.88 |
A high Sortino ratio indicates a lesser chance of negative volatility in the Mutual Fund. Analysts use this information to derive the returns of a fund in a given level of risk.
It is no doubt that the Mutual Fund industry is set on a path of growth for the coming years. Using the mentioned ways in this article, investors can customize how they invest in MFs and the level of risk they wish to take.
For more such posts follow Angel Broking Blog.
Published on: Aug 31, 2021, 8:00 AM IST
We're Live on WhatsApp! Join our channel for market insights & updates

Get the link to download the App

