
Power is one of the most crucial and critical sectors for any economy. Whatever the industry may be services, manufacturing or agriculture, power is required. The existence and development of adequate infrastructure is essential for sustained growth of the Indian economy. Rather as the GDP witnesses growth the demand for power increases.
In the case of India the power sector has come a long way. From being a power deficit country to being one of the most diversified power sectors based on the sources of power generation (Thermal, Gas, lignite and even the renewable), the journey has been very interesting. As of today India has got a total installed generation capacity of 384115.94 MW. The following chart clearly shows the Indian capacity at different stages.
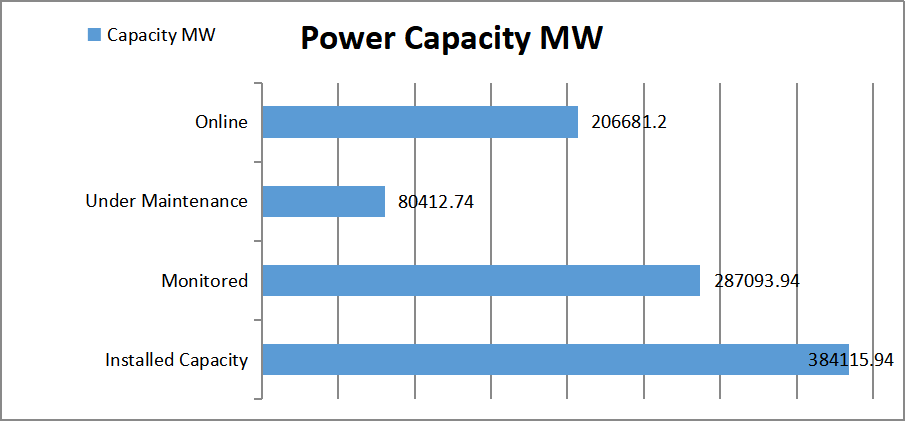
In the above chart the monitored capacity means the capacities above 25 MW. Further the installed capacity is exclusive of the internal consumption of plants. As regards the diversification of the source of generation, the following chart gives detailed information.
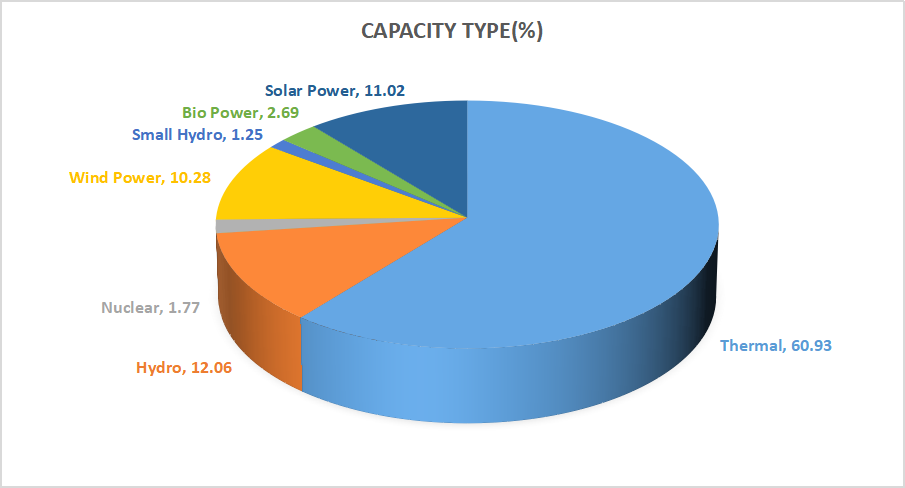
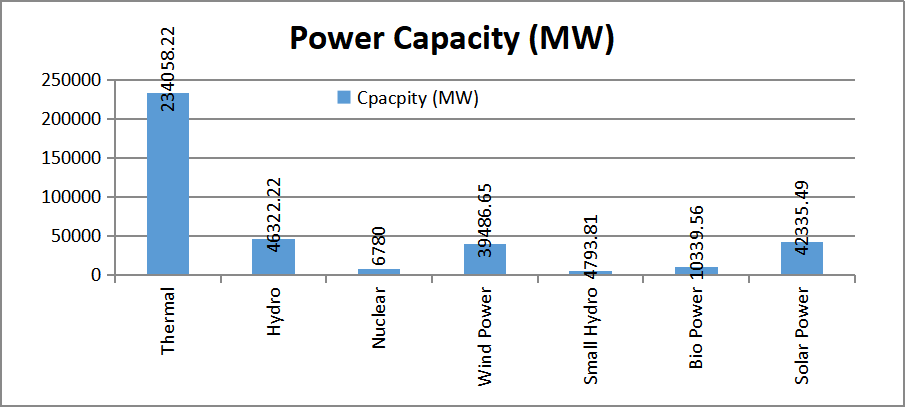
The above chart shows that Thermal forms the majority of the capacities. Even the Hydro had been a preferred way in India. But renewables are now catching up with conventional sources. While the pie Chart gives the number in percentage terms, the following chart shows the capacity in absolute terms.
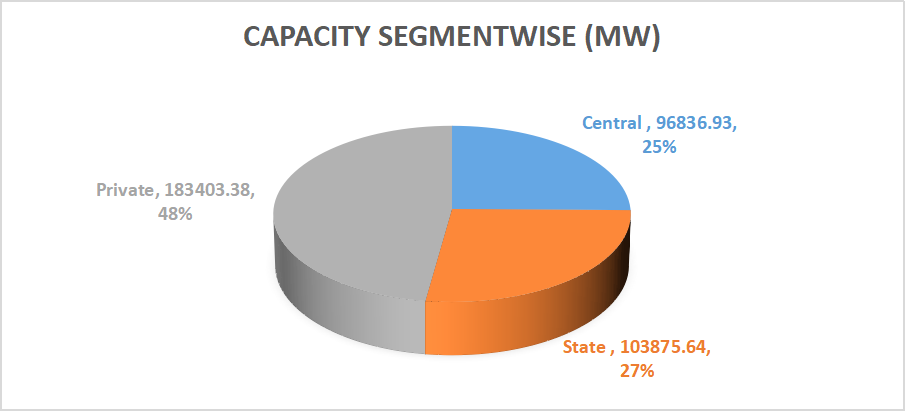
As regards the capacities segregated in terms of state owned, central and private companies the following chart shows the clear picture. The Power sector is dominated by private companies and the scenario is expected to be the same going ahead as well. Reason being the private capex on the higher side and even the focus on renewable (mostly private).
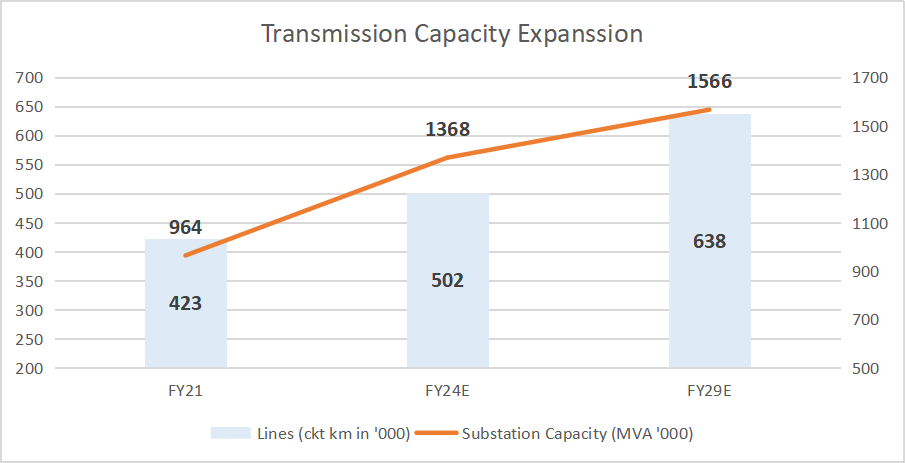
As regards the capex and expansion, the generation capacity is likely to witness growth. The real challenge would be on the transmission side. Rather we expect the transmission capex to be on the higher side. To put the same in better perspective the following chart shows how the transmission cape would be going ahead. The transmission lines and substations would be in the focus here and we feel the transmission sector would be a buzzing space. Over FY21-FY30, we expect steady growth in electricity consumption alongside stronger capex discipline, distribution sector reform, sustained growth in renewable energy generation, and rising private sector participation in the transmission space. We, therefore, prefer companies with higher exposure to the renewable, distribution and transmission segments.
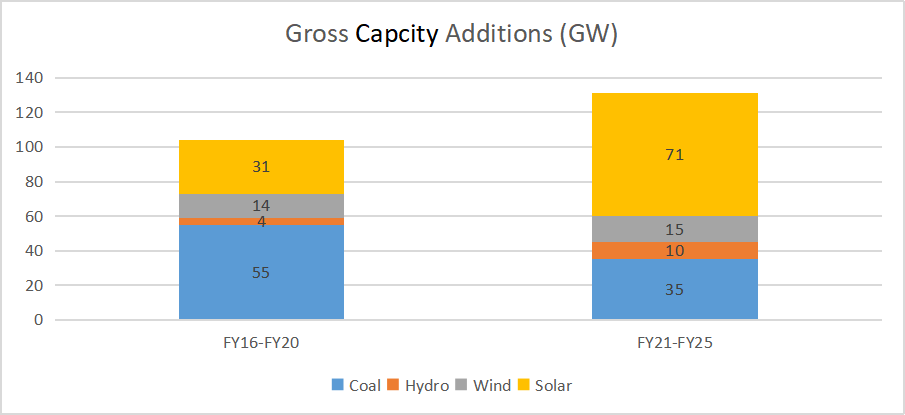
On the generation front, the power Capacities are likely to increase consistently with the consistent growth on the GDP front. To put in simple terms the GDP growth witness’s growth, the power demand is likely to increase at a rate of 5 percent. However unlike the past where the focus was on thermal projects, going ahead the focus will be on renewable. The following chart shows how more solar would be focused.
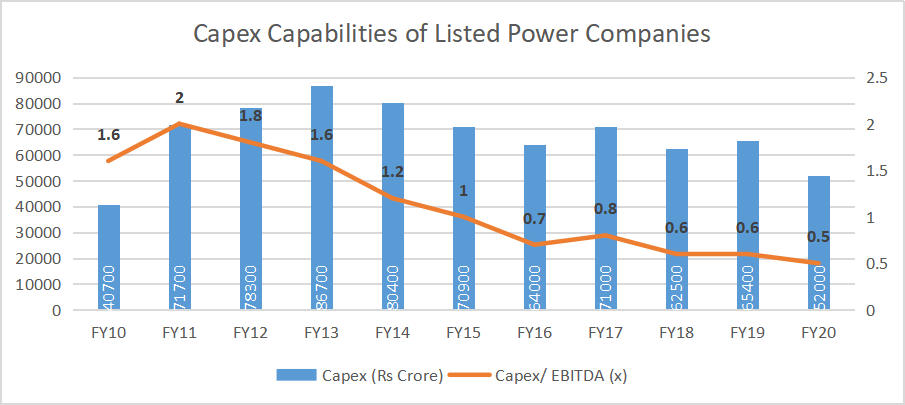
While this is on the sector front, we must look at the capex expected from the individual players as well. One must understand that the Power is a very capital intensive business and the debt ratio has been historically higher. Around a decade back we had seen a lot of companies going ahead with heavy capacity additions. This not only overleveraged the balance sheets of power players but also led to over capacities in few cases. Many would think that even this time there are possibilities of over capacities. But then, the following chart gives a good idea how it may not be the scenario this time. Here it clearly shows that the capex made by the listed space is at the lowest in the past decade. Further the cost of building renewable assets has Declined Significantly over the past few years. In Cases of Solar the cost has declined by almost 90 percent.
We must understand that the cost of building thermal projects has not declined so the focus is expected to be on renewables. India’s electricity consumption can accelerate as GDP climbs – evidenced by past trends in many countries. At a conservative average GDP growth rate of 5 percent over FY20-FY30, we could see power demand rising by 1.6x, which would still be just 50 percent of the current global mean.
Considering all the factors and parameters, the transmission segment seems to be a larger opportunity for growth. Transmission privatisation has gathered space. However load management remains a key challenge. Besides load management, another challenge faced by the transmission sector is the lack of information on generation project development, leading to a mismatch in transmission line versus generation capacity.
While we have analysed the power sector scenario, it is now time to look at the top ten players in the industry based on the market capitalisation.
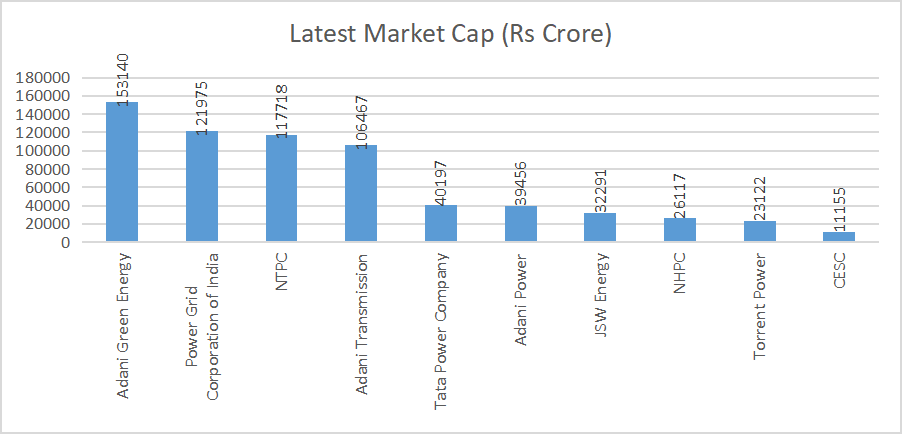
We have added power generation and transmission companies to the list. The top slot is earned by Adani Green Energy with a market capitalisation of Rs 1,53,140 crore. This is a renewable company and the scrip has surged recently to grab the top Spot. The second spot and third spot are earned by Public Sector Undertakings (PSUs) Power Grid Corporation of India and NTPC. Let’s have a look at the complete top ten list. Like we usually do, we have provided the sales And PAT numbers for FY21.
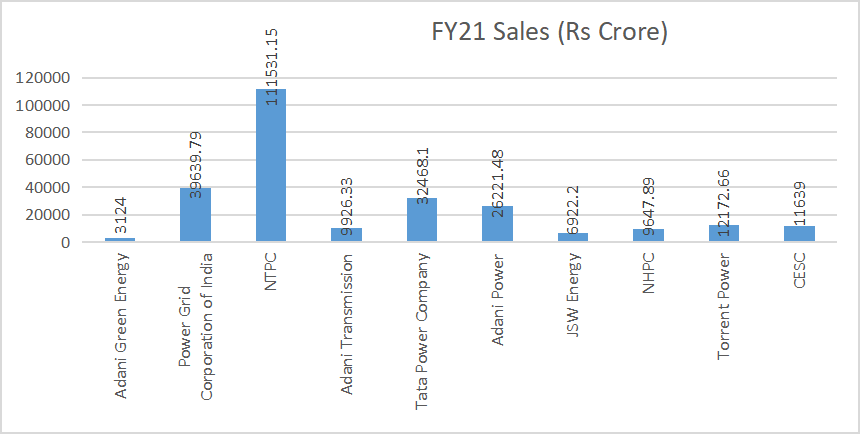
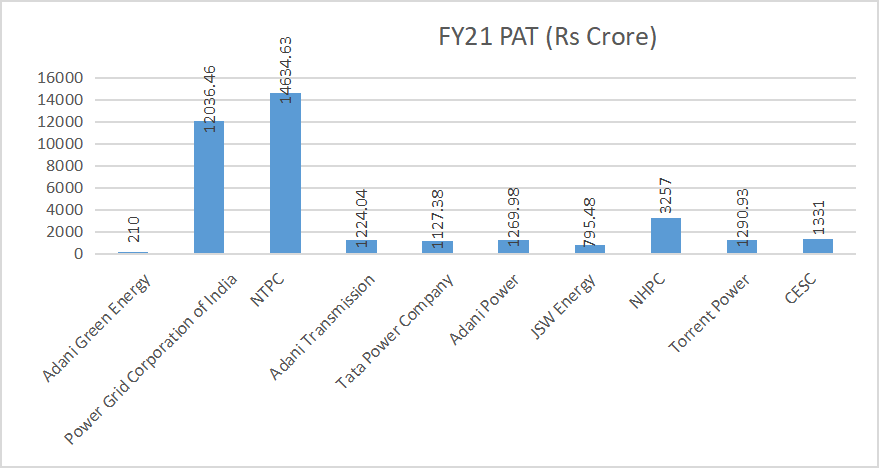
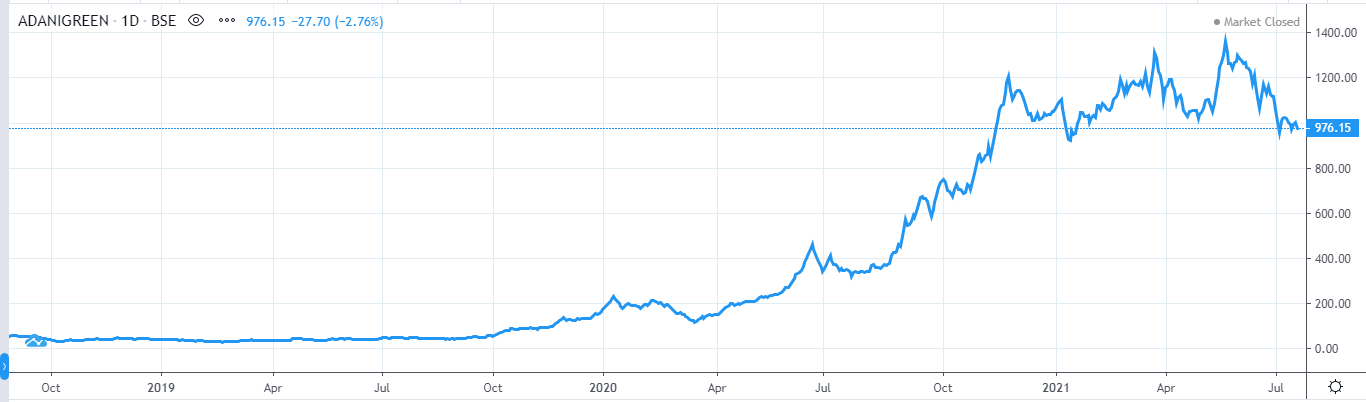
Adani Green Energy is one of the largest renewable companies in India, with a current project portfolio of 13,990 MW. With a market capitalisation of Rs 1,53,140 crore Adani Green Energy is at the top of the list. As regards the other details it posted a topline of Rs 3124 crore and bottomline of Rs 210 crore in FY21. The 52 week high for the scrip was Rs 1390 posted on May 25, 2021. The 52 week low was Rs 305.60 made on July 24, 2020.
Power Grid Corporation of India owns 40 percent of India’s transmission assets. Private sector participation in transmission may increase but inherent entry barriers are likely to keep competition in check for the company. The market cap of the company stands at Rs 1,21,975 crore. The topline for FY21 was Rs 39,639 crore and PAT was Rs 12,036 Crore. The 52 week high for the stock was 251.50 as on June 15, 2021 and the 52 week low was Rs 154.60 as on October 15, 2020.
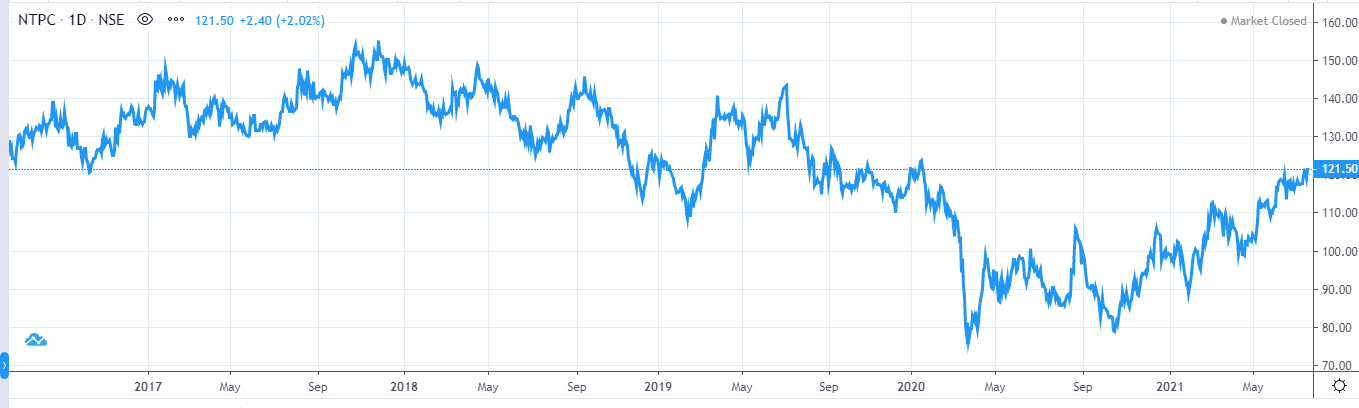
NTPC’s 62GW generation capacity as at end-FY20 is 17 percent of India’s total and 22 percent of coal-based capacity. The company offers low-risk earnings visibility as more than 90 percent of its portfolio earns regulated returns that are protected from cost increases. Market cap stands at Rs 1,17,718 crore. Topline for FY21 was Rs 111531 crore and bottomline was Rs 14635 crore. 52 week high of Rs 122 was made on July 13, 2021 and the 52 week low was made on October 14, 2020.
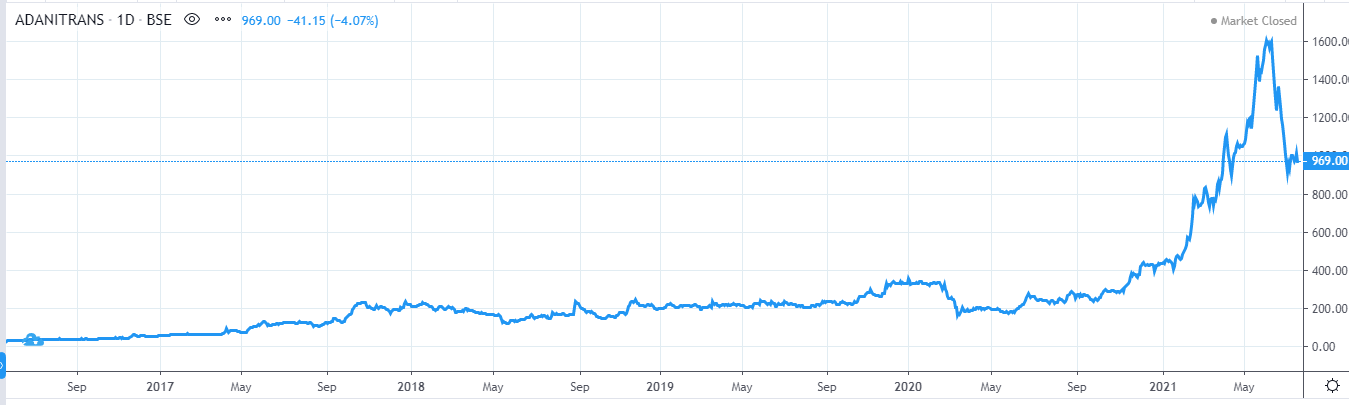
With 27 transmission projects and 75 substations Adani Transmission is making its presence felt in the sector. Market Capitalisation of the company stands at Rs 1,06,647 crore. Then topline for FY21 was Rs 9926.33 crore and the PAT was Rs 1224 crore. 52 week high of Rs 1644.95 Was made on June 7, 2021 and the 52 week low of Rs 221 was made on July 28, 2020.
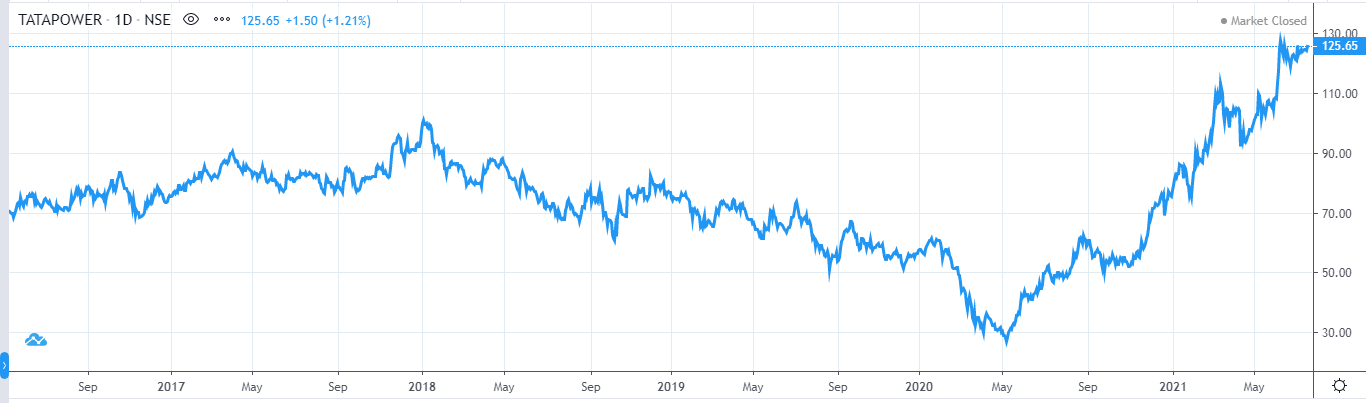
Tata Power Company has got fast-growing segments of power distribution and renewables featuring among top 10. Then it is a top player in solar EPC and rooftop solar solutions. The company has made good progress on debt reduction in FY21. Market capitalization of the company stands at Rs 40197 crore. The topline for FY21 was Rs 32468 crore and PAT stood at Rs 1127.38 crore. The scrip price touched a 52 week high of Rs 132.70 on June 9, 2021 and 52 week low of Rs 45.95 on July 16, 2020.
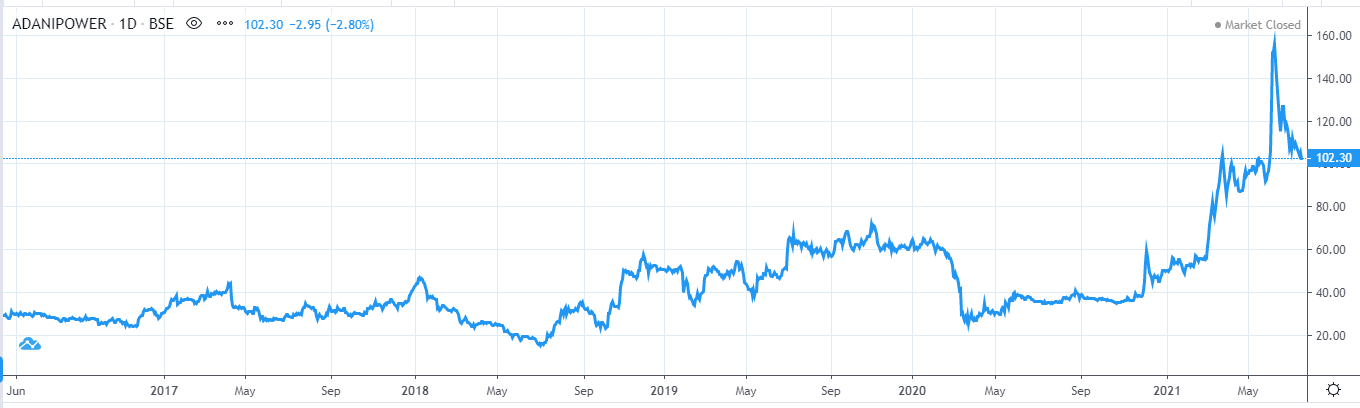
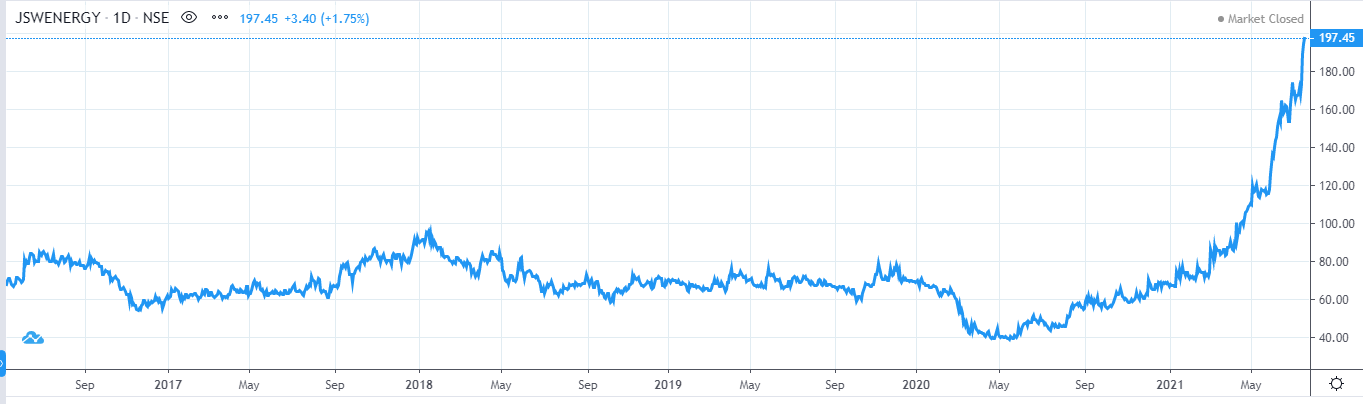
Market Cap Rs 39,465 crore. 52 Week High Rs 167 (June 9, 2021), 52 week low Rs 34.50 (July 16, 2020)
Market Cap Rs 32,291 crore. 52 Week High Rs 195 (July 16, 2021), 52 week low Rs 43 (July 16, 2020)
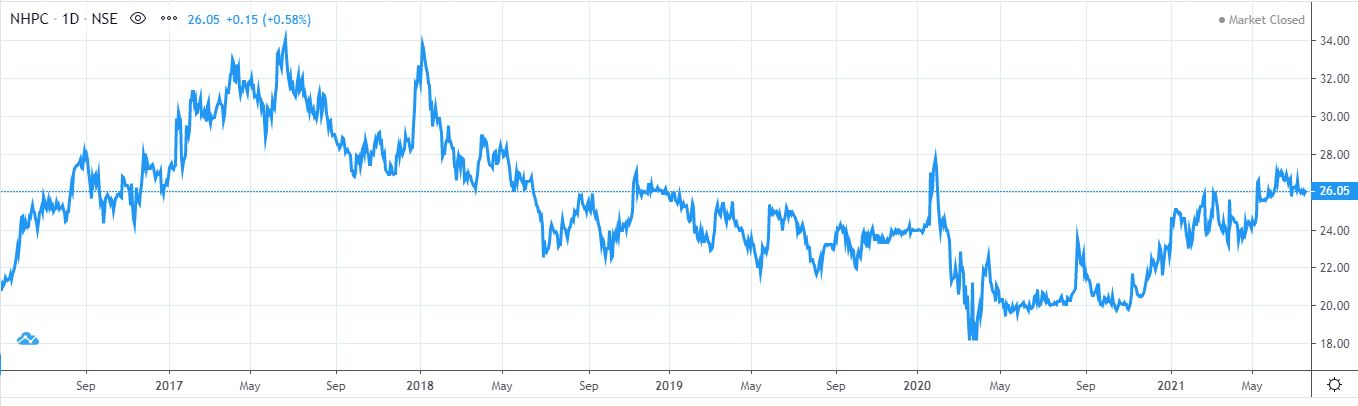
Market Cap Rs 26,117 crore. 52 Week High Rs 26.70 (May 12, 2021), 52 week low Rs 19.70 (July 16, 2020)
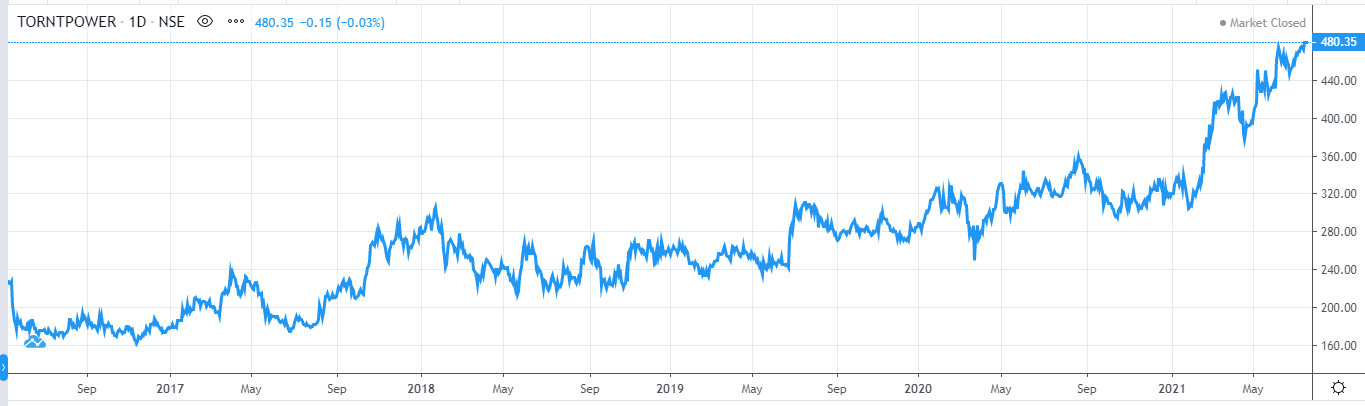
Market Cap Rs 23,122 crore. 52 Week High Rs 509 (June 9, 2021), 52 week low Rs 293 (December 22, 2020)
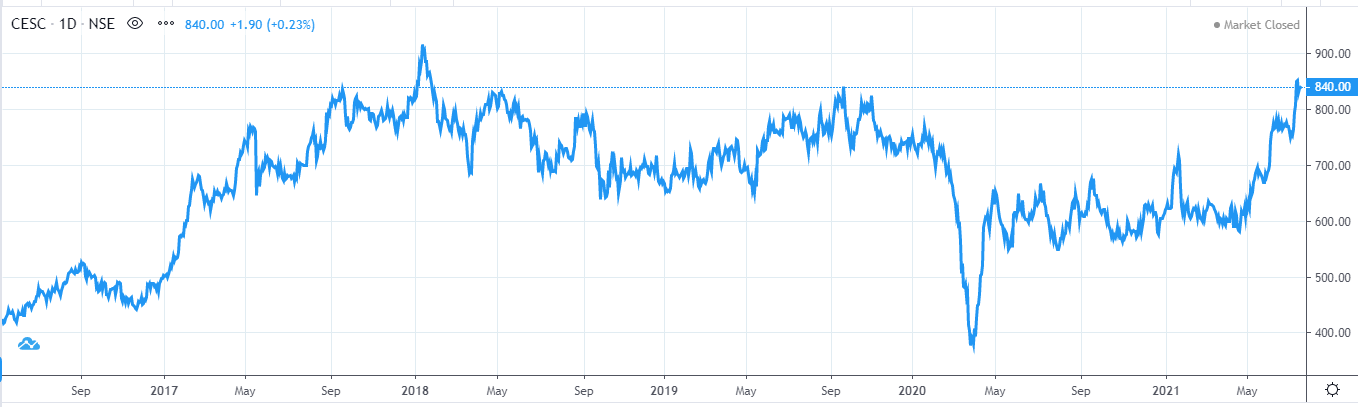
Market Cap Rs 11,155 crore. 52 Week High Rs 871 (July 14, 2021), 52 week low Rs 539 (August 3, 2020)
Published on: Aug 31, 2021, 1:13 AM IST
We're Live on WhatsApp! Join our channel for market insights & updates

Get the link to download the App

