Tuesday proved to be a turbulent day for the Indian stock markets, with both the Sensex and Nifty witnessing a significant downturn. Each of these benchmark indices lost approximately 0.90%, sending ripples of concern through investors. However, the most notable impact was observed in the Nifty Bank Index, which faced a strong sell-off, primarily driven by a sharp decline in the shares of HDFC Bank.
Shares of HDFC Bank plummeted by 3% on Tuesday, a surprising reaction triggered by a lower-than-anticipated increase in the stock’s weight within the MSCI index. The global index provider, MSCI, announced that HDFC Bank’s weight would be increased gradually, in two phases, eventually reaching a full weight of 1. However, market participants had expected a more immediate impact, with a 50 basis points increase in the upcoming rebalancing scheduled for August 30. Instead, MSCI revealed that the adjustment would only be a 25 basis points increase, leading to widespread disappointment and a subsequent sell-off.
In its index announcement on August 12, MSCI confirmed that HDFC Bank would remain in its indices with an increase in the Foreign Inclusion Factor (FIF) from 0.37 to 0.56, effective from September 2, 2024. Despite this positive news, the market’s reaction was driven by the discrepancy between expectations and reality, resulting in HDFC Bank logging its sharpest single-day fall in over a month.
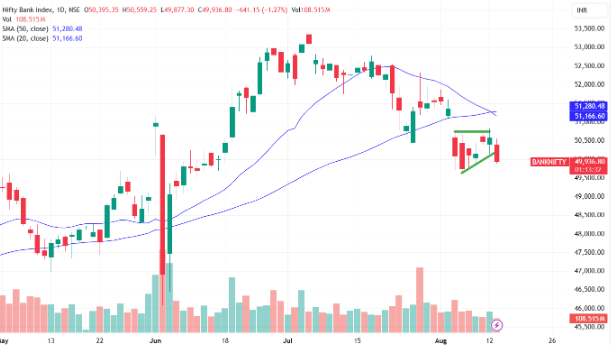
The Nifty Bank Index has been under considerable pressure, with recent technical signals pointing towards continued bearish momentum. Following a peak in June, the index has been on a consistent downward trajectory, characterized by lower highs and lower lows—a classic bearish trend formation.
A deeper look into the daily chart reveals a critical breakdown from a triangle-like pattern. This pattern, typically associated with periods of consolidation, often precedes a breakout. Unfortunately for bullish investors, the breakout in this case has been to the downside, further exacerbating the bearish sentiment surrounding the index.
Adding to the bearish narrative, the Nifty Bank Index is currently trading below its 20-day and 50-day Simple Moving Averages (SMAs), which are widely regarded as key indicators of short-term and medium-term trends. The 20-day SMA is positioned at 51,166.60, while the 50-day SMA is at 51,280.48. The index’s decline below these levels underscores the weakening market sentiment.

One of the most critical developments in the Nifty Bank Index’s technical setup is the bearish crossover of the 20-day Simple Moving Average (20-DMA) below the 50-day Simple Moving Average (50-DMA). This crossover is often viewed as a powerful bearish signal, indicating that short-term momentum has deteriorated more rapidly than the medium-term trend. The bearish crossover suggests that the index may face further downside risk in the near term, as sellers continue to dominate the market.
As the market digests the unexpected weight adjustment in the MSCI index, HDFC Bank is approaching crucial support levels between Rs 1,588 and Rs 1,593. These levels are likely to be closely watched by traders and investors alike, as a breach below this zone could trigger further selling pressure.
The private lender’s significant contribution to the Nifty Bank’s decline—over 500 points—has been a major factor in dragging the index below the psychologically important mark of 50,000. With the Nifty Bank Index already in a challenging phase, the focus will now shift to whether these support levels can hold, or if the bearish momentum will continue to dominate.
Disclaimer: This blog has been written exclusively for educational purposes. The securities mentioned are only examples and not recommendations. It is based on several secondary sources on the internet and is subject to changes. Please consult an expert before making related decisions.
Published on: Aug 13, 2024, 3:35 PM IST
We're Live on WhatsApp! Join our channel for market insights & updates
