
Currency market allows investors to trade in foreign currencies and diversify portfolio for profit optimisation. In volume, it is the largest financial market, even bigger than the equity market. In forex marketplace, currencies are bought and sold against each other, usually within a short period, which can be a day, an hour, or even a few minutes. But it is highly volatile and runs on high-risk factors. It becomes a bit of a challenge for traders, especially for the new ones, to understand trends and identify investment opportunities.
How to trade in forex market? To answer this, traders use various analytical tools to understand market movement and investment opportunities. Multiple time frame analysis is the most popular one used by traders across the world. However, before explaining what it is, let’s understand how a forex market works.
What is forex market?
A forex marketplace is where currencies are exchanged against each other, and traders use price differences to make capital gains. Unlike equity market, forex trading happens across different international locations and different zones during a day. Currencies are traded through different financial instruments like spot transactions, forwards, swaps, and options contracts. Forex market remains open for 24 hours, around the world, for five days a week.
To trade in forex market, one needs to understand different exchange rates and also which way the market is moving. Multiple time frame analysis helps in discovering underlying trends. It involves reading charts and developing strategies based on long-term upward or downward movements of currencies while marking ideal short entry points on a smaller time frame chart.
How to study multiple time frame analysis
Multiple time frame analysis involves monitoring the performance of a pair of currencies at different frequencies. There are multiple charts available like a weekly, daily, 4-hour chart, 60 minutes, 10 minutes, and even 1-minute charts which are used by traders to base their speculations. Here are a few more definitions that are commonly used in association with multiple time frame analysis.
Intraday Chart: This chart is used to view a single day’s movement from the opening of a trading session to closing. The most commonly used time frame in an intraday chart is the hourly chart or the 60-minute chart.
Daily Chart: This chart marks the journey of a currency from a day beginning to a day end. It allows traders to form a generic overview of market and base their trading decisions on long-term analysis.
Similarly, there are weekly and monthly charts that give you a long term overview of market, and 10 (1:6) minutes and 15 (1:4) minutes charts, which analyse performance over a shorter time frame.
See the following examples of charts
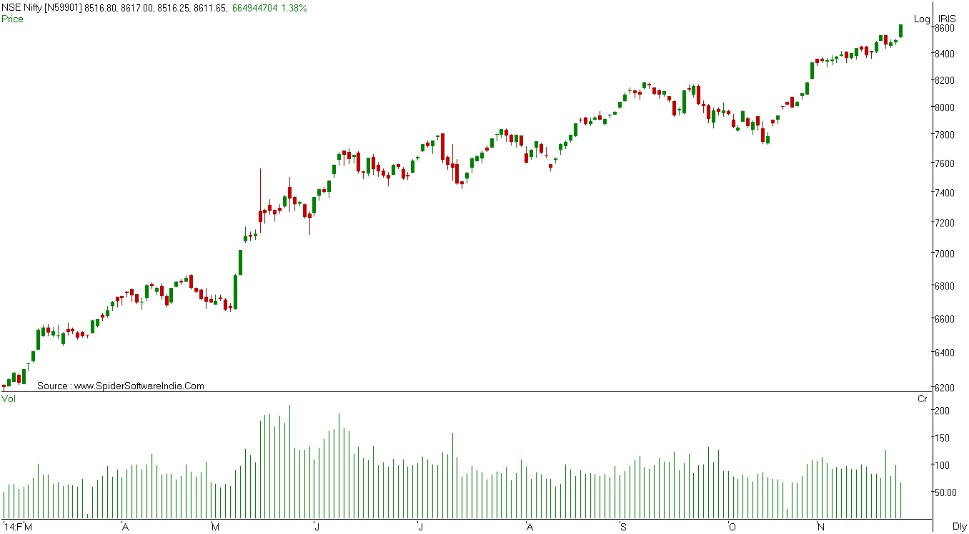
Example: 60 min chart or hourly chart or intraday chart
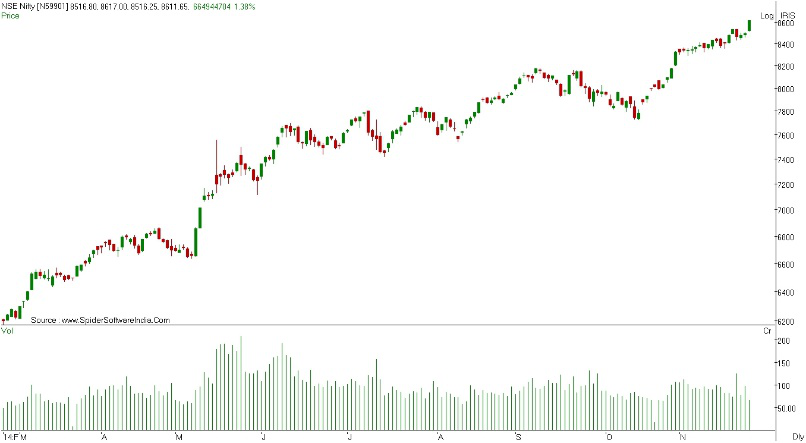
Example: Daily Chart
Do you find it confusing? The rule of thumb suggests comparing the 10-minute chart or the 15-minute chart to identify right entry point in the market and recommends the weekly and daily charts for observing general trends.
How do traders identify the best time for trading?
Forex trading depends largely upon your ability to speculate, but these guesses aren’t baseless, rather supported by data and analytics. Traders use two parameters, based on their trading patterns, to identify the best time frame to trade.
| Trader Style | Holding Period | Trend Chart | Entry Chart |
| Long-term | More than 1 day | Weekly | Daily |
| Swing-trader | Few hours to few days | Daily | 4 hours |
| Short-term | Less than 1 day | 4 hours | Hourly |
| Scalper | Less than a few hours | Hourly | 15 minutes |
How to use multiple time frame analysis to trade in the market
Your analysis of multiple time frame will depend on your trading pattern. If you are a daily trader, you usually get the whole day to monitor trends and can jump in whenever an opportunity window opens. So, how do you choose a time frame? Most traders, especially the newbies, select a particular time frame and usually stick to it.
While using multiple time frame for currency trading, most experts recommend the top-down approach. That is, looking at a wider time frame first and then moving towards smaller duration analysis. It helps in two ways. Firstly, it allows you to identify trends more accurately and secondly, it eliminates trading biases – helping you to speculate with confidence.
To trade foreign exchange in India, you need to open a foreign exchange trading account with a SEBI registered trading house like Angel One. Angel One offers the needed expertise and research solution to help foreign exchange traders to trade efficiently and with confidence in forex market.
Published on: May 14, 2020, 1:24 PM IST
We're Live on WhatsApp! Join our channel for market insights & updates

Get the link to download the App

