
Polycab shares recovered on Monday from Friday’s low of Rs 3,801 following the income tax department’s revelation of uncovering “unaccounted cash sales” of approximately Rs 1,000 crore during searches of the company’s facilities.
The stock has been in a downtrend, falling more than 26% from its all-time high. The stock is showing signs of deterioration, as shown by technical charts and open interest data.
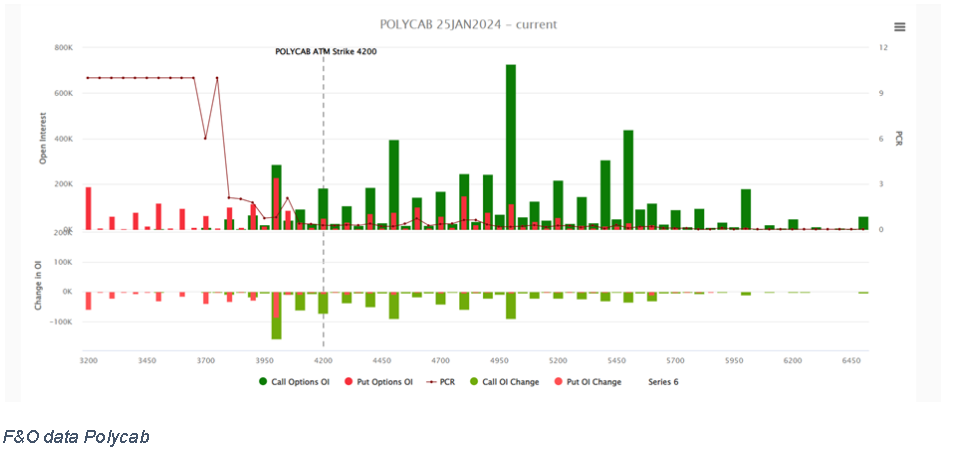
According to the options data, the Polycab scrip has critical support at Rs 4,000, followed by Rs 3,900, with a tussle between put and call writers at Rs 4,000 witnessed in the last two trading sessions based on the option chain.
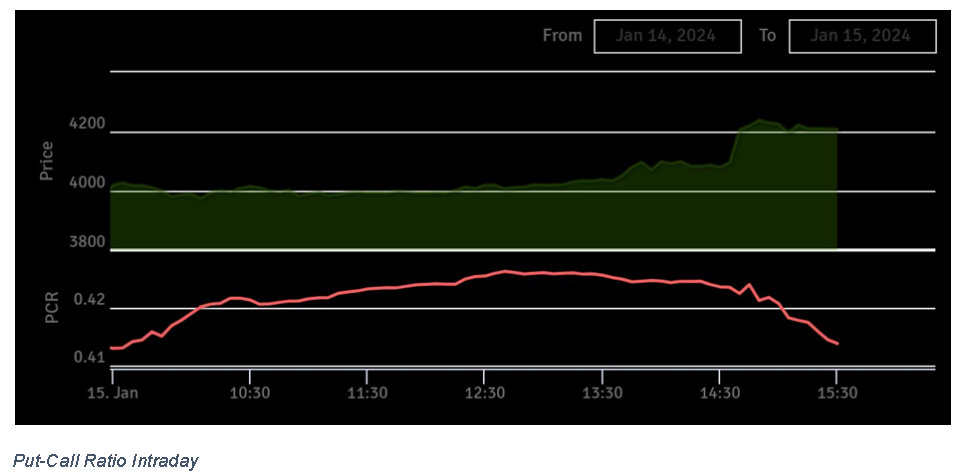
PCR gained significantly throughout the day, and when the market came to a close, the PCR maintained its opening position where F&O data suggested short-covering indicators.
Looking at the intraday futures data, we can clearly see a price increase of 5.18% and a decline in OI of 5.64%, with volume also falling by 19.85%. Given the build-up equation, this is a strong indication of short-covering in the price of Polycab Ltd for a shorter time period. If we look at the OI data on a weekly basis, the price has fallen by 21.98% while OI has climbed by 152.23% and volume has increased by 12.57%, indicating a huge short-buildup and a bearish prognosis for the long run.
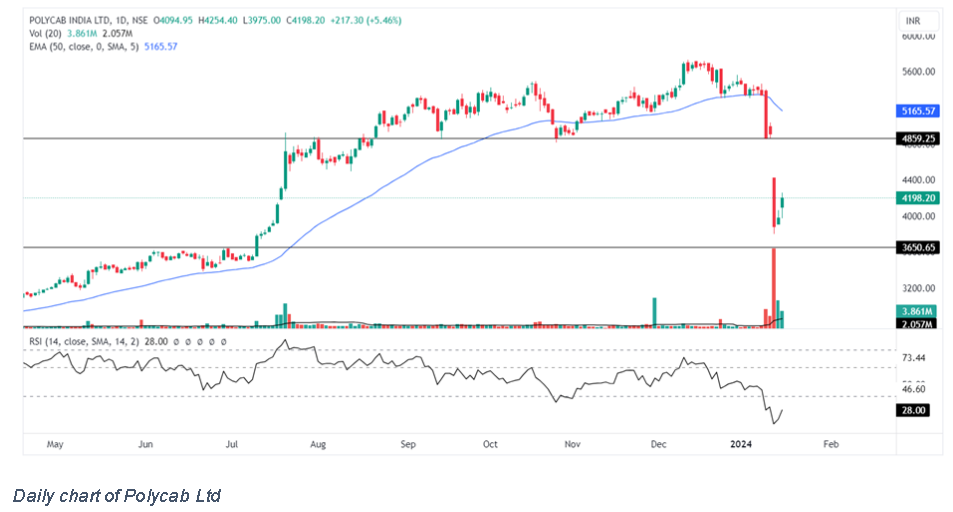
The upcoming critical support zone is situated between Rs 3,400 and Rs 3,650, marked by the long-term trendline support and previous support-resistance lines. This range is likely to witness consolidation, acting as a pivotal area for potential market movements.
Analyzing Open Interest (OI) data and employing technical analysis, there are indications of a short-covering rally and a recovery from the overbought condition in the Relative Strength Index (RSI). These factors suggest a potential continuation of the bullish momentum, possibly leading to a breach of the January 11, 2024, high.
Thursday’s trading session saw a significant surge in volume, primarily attributed to market-moving news. The possibility of filling the open gap is on the horizon if the current market sentiment persists or if short-covering activities extend further. Traders and investors should closely monitor these developments as they could significantly impact market dynamics in the near term.
Disclaimer: This blog has been written exclusively for educational purposes. The securities mentioned are only examples and not recommendations. The information is based on various secondary sources on the internet and is subject to change. Please consult with a financial expert before making investment decisions.
Published on: Jan 15, 2024, 7:04 PM IST
We're Live on WhatsApp! Join our channel for market insights & updates

Get the link to download the App

