
Monday saw the Nikkei 225 scaling to the point where it managed to break the barrier of the past thirty years on an intra-day basis, but it quickly reversed course and moved slightly lower as investors became wary of the index’s recent sharp gains on the intraday basis. Nikkei index is a stock market index for the Tokyo Stock Exchange.
The constituents of the Nikkei 225 have been pushing the index higher since the start of November. The Bank of Japan (BOJ) is the only major central bank that is still keeping interest rates very low. This is making Japanese stocks more attractive to buyers.
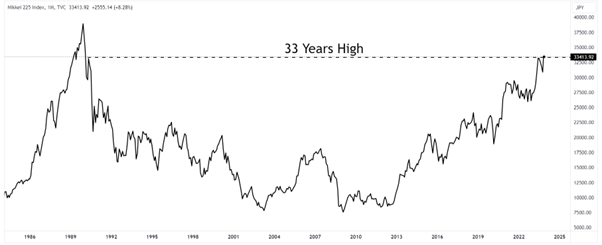
Monthly Chart of Nikkei 225 Index
Nikkei’s share average is trading at 33,400.58 points at the time of writing, retreating from its 33-year high. Over 33 years Nikkei 225 saw ups and down after a huge fall in 1989, in the year 2013 it picked up the pace to achieve new heights by forming new Higher Highs and Higher Lows. The index is currently looking bullish on the longer-term timeframe but the below technical char of the daily candle may give us a clear and accurate picture with the help of technical analysis.
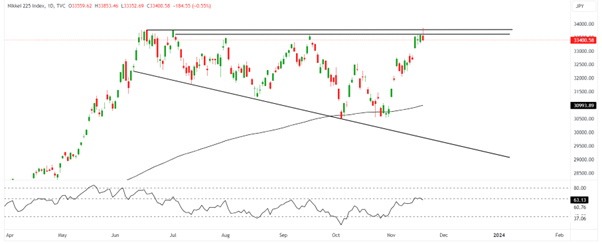
Daily Chart of Nikkei 225 Index
The Nikkei 225 Index, a benchmark for the Japanese stock market, has been exhibiting a captivating pattern that has captured the attention of traders and analysts alike. The Descending Right-Angled Broadening Wedge (DRABW) pattern, a technical formation characterized by converging trendlines, has emerged, signalling a potential turning point for the index.
The DRABW pattern is a technical indicator that suggests a reversal in the prevailing trend. In the case of the Nikkei 225 Index, the descending trendline indicates a downward movement, while the horizontal trendline suggests a period of consolidation. The converging trendlines create a wedge-shaped pattern, hinting at a potential breakout or breakdown.
The Nikkei 225 Index is currently hovering at the upper resistance of the DRABW pattern, forming a declining candlestick with a larger wick upside. This formation indicates indecision among market participants and suggests a potential pullback. If the price action closes below Thursday’s low of 33233.84, it could trigger a correction in the index following the gap-closing activity.
The Nikkei 225 Index continues to trade above all 50-day EMAs, 100-day EMAs, and 200-day EMAs. This suggests that the long-term trend remains bullish, providing a supportive backdrop for the index.
The Relative Strength Index (RSI), an indicator that measures the speed and magnitude of price movements, is currently declining from 65. This suggests that the index may be entering a ranging phase, where prices fluctuate within a defined area.
A decisive breakout above the DRABW pattern’s upper trendline could trigger a strong bull rally, potentially pushing the index towards its all-time high of 38,957. Conversely, a closing below Thursday’s low could signal a correction, potentially leading the index to retrace towards the 200-day EMA at 30,445.81.
The Nikkei 225 Index stands at a technical crossroads, with the DRABW pattern signalling a potential reversal in the prevailing trend. While a breakout could lead to significant upside potential, a smaller gap closing could trigger a correction. Traders should carefully evaluate the price action and employ sound risk management practices to navigate this dynamic trading environment.
Disclaimer: This blog has been written exclusively for educational purposes. The securities mentioned are only examples and not recommendations. It is based on several secondary sources on the internet and is subject to changes. Please consult an expert before making related decisions.
Published on: Nov 20, 2023, 1:03 PM IST
We're Live on WhatsApp! Join our channel for market insights & updates

Get the link to download the App

