
The Tata Group and Aditya Birla Group are widely recognized entities in India, enjoying strong goodwill among both customers and shareholders. The Tata Group has consistently been in the spotlight, experiencing significant changes such as its upcoming IPOs and the recent listing of Tata Technologies Limited. Meanwhile, Aditya Birla Group companies like Grasim Industries have ventured into new segments, such as the decorative paint business, and FPO of its telecom company Vodafone Idea.
Both entities have their unique specialties. Tata Group has diversified into various sectors including IT, steel, automobile, chemicals, FMCG, fashion, hotels, jewelry, and more. According to data from the Tata website, there are approximately 18 stocks listed under the Tata Group.
On the other hand, the Birla Group also has diversified business streams but not to the extent of Tata’s. The group has around 8 companies listed, spanning sectors such as cement, fashion, telecom, finance, investments, and others.
In this article, we will compare the total market capitalization of both entities, as well as the returns of all stocks listed on the Indian stock market under their respective groups.
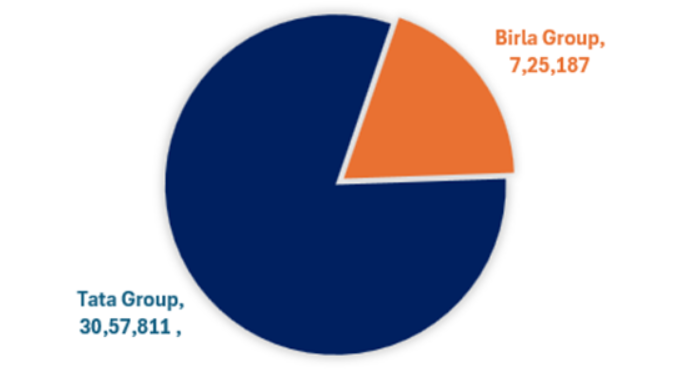
The Tata Group holds a significantly larger market capitalization compared to the Aditya Birla Group. Currently, the total market capitalization of all Tata Group listed entities stands at approximately Rs 30.57 lakh crore. In contrast, the Aditya Birla Group’s market capitalization for all its listed entities amounts to around Rs 7.25 lakh crore. This stark difference in market capitalization illustrates that the Tata Group is over four times larger than the Aditya Birla Group in terms of overall size.
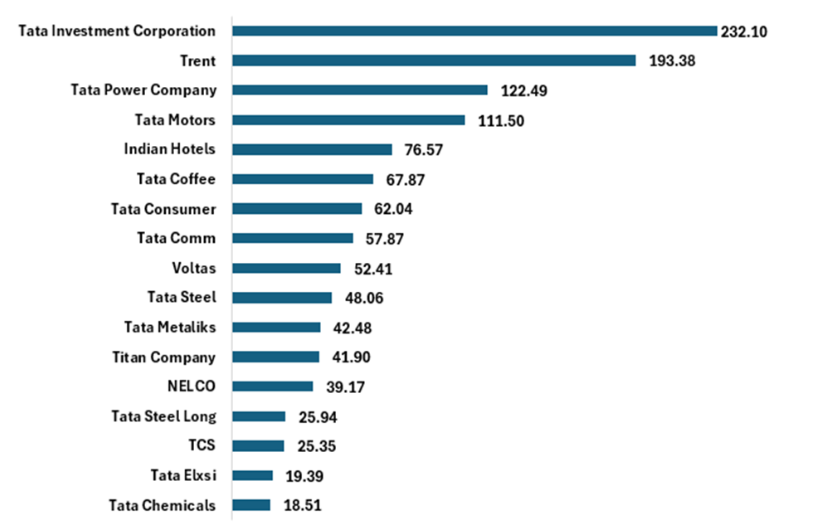
The Indian markets have been exhibiting strength compared to global markets, although there has been a slight correction in the last three trading sessions from peak levels. When comparing the performance of stocks listed under both entities over the past year, one notable stock stands out. Tata Investment Corporation, belonging to the Tata Group, has delivered an impressive multibagger return of over 200%. However, among the stocks listed under the Birla Group, none have managed to achieve a return of over 200% according to current details.
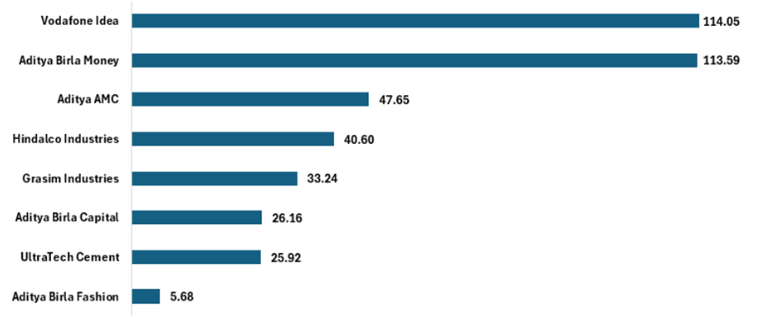
From the Birla Group, two stocks have demonstrated significant returns exceeding 100% based on current data. Vodafone Idea, despite being a low-priced stock, has delivered a return of around 114%. Additionally, Aditya Birla Money Limited has also showcased a remarkable return of approximately 113%.
On the other hand, the Tata Group has seen three stocks outperforming, with impressive returns over the past year. Trent has surged by approximately 193%, marking a substantial increase. Furthermore, Tata Power and Tata Motors have delivered notable returns of around 122% and 111% respectively, contributing to the Tata Group’s strong performance in the market.
| Company Name | CMP Rs | Mar Cap Rs Cr | 1Yr return % |
| Tata Investment Corporation | 6,949.80 | 35,162.73 | 232.10 |
| Trent | 4,144.30 | 1,47,324.67 | 193.38 |
| Tata Power Company | 438.75 | 1,40,195.45 | 122.49 |
| Tata Motors | 993.75 | 3,63,783.01 | 111.50 |
| Indian Hotels | 595.95 | 84,829.43 | 76.57 |
| Tata Coffee | 344.80 | 6,439.84 | 67.87 |
| Tata Consumer | 1,152.15 | 1,09,780.95 | 62.04 |
| Tata Comm | 1,898.00 | 54,093.02 | 57.87 |
| Voltas | 1,301.95 | 43,079.58 | 52.41 |
| Tata Steel | 163.50 | 2,04,105.69 | 48.06 |
| Tata Metaliks | 1,110.55 | 3,506.84 | 42.48 |
| Titan Company | 3,630.55 | 3,22,315.27 | 41.90 |
| NELCO | 755.10 | 1,723.13 | 39.17 |
| Tata Steel Long | 829.95 | 3,743.07 | 25.94 |
| TCS | 3,922.15 | 14,19,068.23 | 25.35 |
| Tata Elxsi | 7,525.85 | 46,868.31 | 19.39 |
| Tata Chemicals | 1,131.70 | 28,831.15 | 18.51 |
| Tata Technologies | 1,059.00 | 42,960.28 |
| Company Name | CMP Rs | Mar Cap Rs Cr | 1Yr return % |
| Vodafone Idea | 13.37 | 65,084.93 | 114.05 |
| Aditya Birla Money | 115.26 | 651.34 | 113.59 |
| Aditya AMC | 514.40 | 14,819.38 | 47.65 |
| Hindalco Industries | 622.80 | 1,39,956.70 | 40.60 |
| Grasim Industries | 2,285.20 | 1,52,716.90 | 33.24 |
| Aditya Birla Capital | 207.00 | 53,831.16 | 26.16 |
| UltraTech Cement | 9,499.00 | 2,74,233.62 | 25.92 |
| Aditya Birla Fashion | 235.15 | 23,893.41 | 5.68 |
In conclusion, our comprehensive comparison between the Tata Group and the Birla Group reveals significant insights into the performance and market presence of both entities. The Tata Group emerges as a formidable force, boasting a market capitalization over four times larger than that of the Aditya Birla Group. Additionally, the Tata Group’s diverse portfolio of stocks has delivered impressive returns over the past year, with notable multibagger performances from stocks such as Tata Investment Corporation, Trent, Tata Power, and Tata Motors.
On the other hand, while the Aditya Birla Group showcases resilience and innovation in various sectors, its market capitalization and stock performance trails behind that of the Tata Group. Nevertheless, stocks like Vodafone Idea and Aditya Birla Money Limited have demonstrated commendable returns, showcasing potential opportunities within the Birla Group’s portfolio.
Disclaimer: This post has been written exclusively for educational purposes. The securities mentioned are only examples and not recommendations. It is based on several secondary sources on the internet and is subject to changes. Please consult an expert before making related decisions.
Published on: Apr 18, 2024, 5:45 PM IST
We're Live on WhatsApp! Join our channel for market insights & updates

Get the link to download the App

