
Angel One has upgraded its app across Desktop and iOS with the first version of Super App. We are also doing a phase wise upgrade on the Android version to extend this experience and factoring in the feedback as we roll out the new version.
First of all, Super App will cater to asset classes beyond Equity. We have built it ground up by optimising the back-end, revamping payment gateway and decluttering the front end. With this upgrade you will experience faster interactions across Order Journey, Charting, Account and a lot more.
Across the past app versions, some of Angel One’s frequent traders had reported slowness in trading through Charts and latency in adding indicators. Our Engineers heard you and they optimised our integrations with ChartIQ and TradingView. This optimisation helped us remove latency and made charts quick and reliable, especially during times of peak order volumes.
In order to access charts, you can click on any Stock either on the Watchlist or on your Portfolio. When you click on a script, you will be initially shown a short sleeve made up of three sections that are a part of the “Overview” of the stock – charts, markets and option chain.
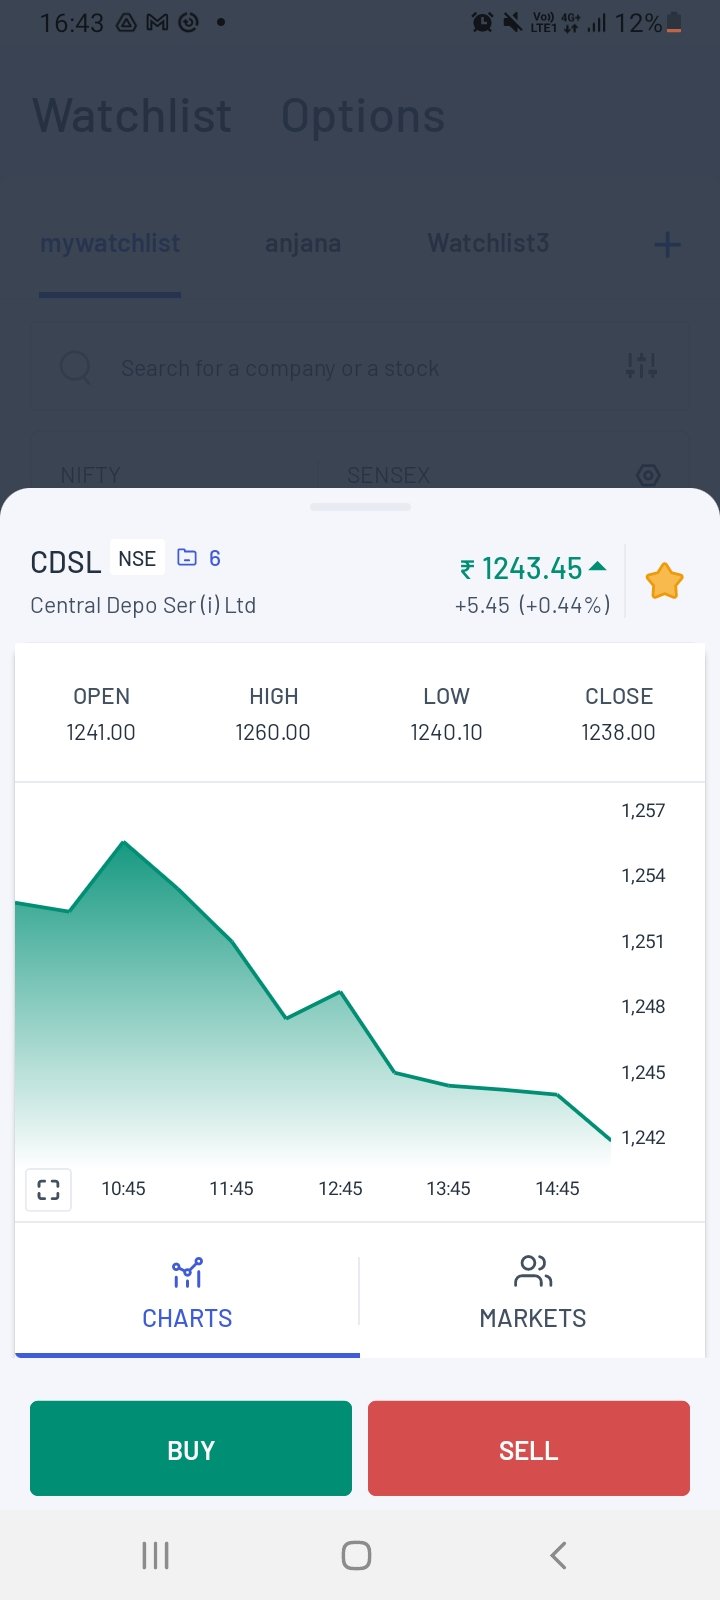
Fig 1: The initial chart
Hereafter, in order to access the enlarged data, tap on the screen and scroll upwards. The entire stock data will emerge with the following sections.
The chart shows the price action of the selected asset – on the x-axis there is the time period and on the y-axis is the price.
Clicking on the enlargement icon towards the bottom left of the chart or tapping on any place on the chart takes you to the more detailed chart with the entire range of additional features and data points. Here you can see the following –
If you click and move two fingers outwards, then you can zoom into the chart – i.e. reduce the time gap from months to days to minutes to be precise.
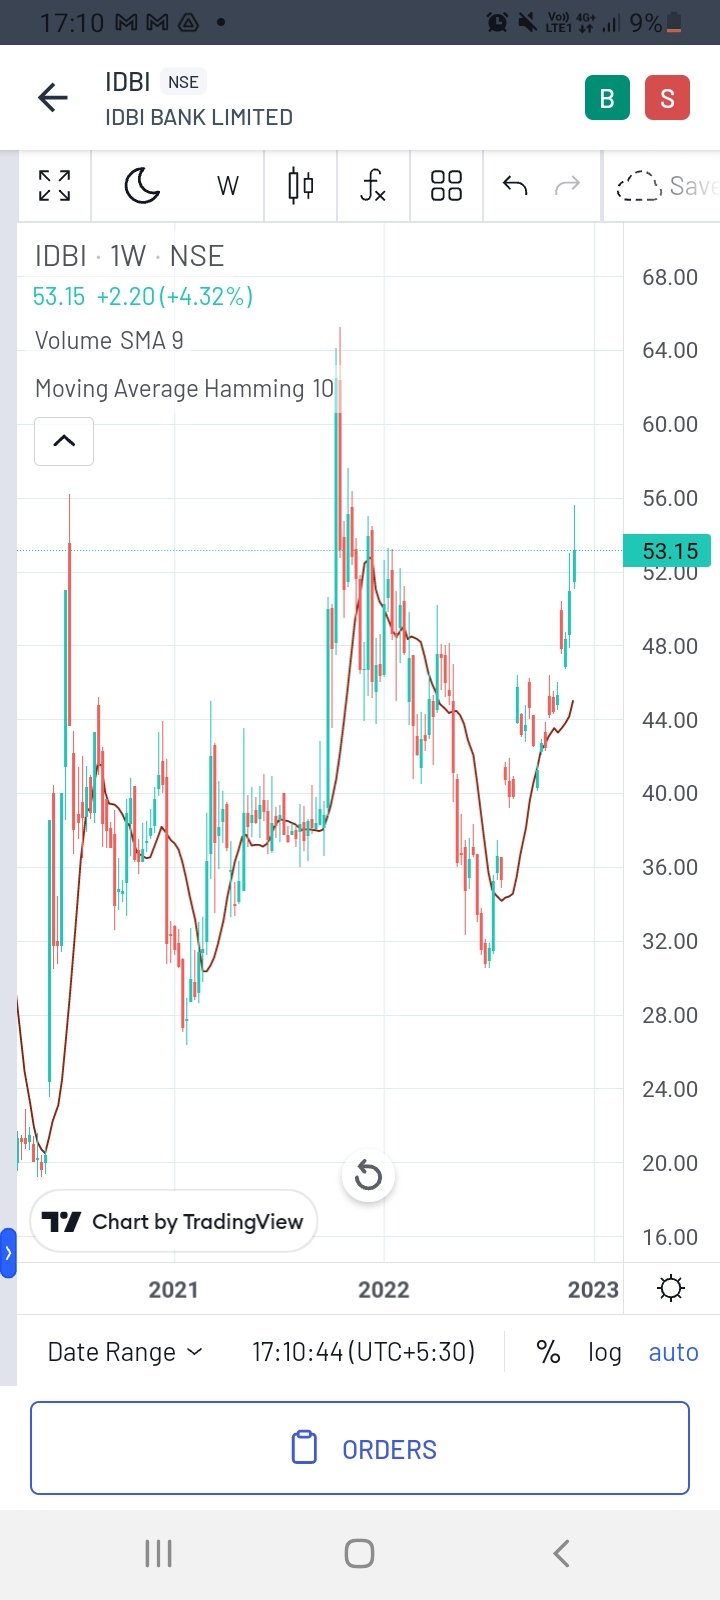
Fig. 2: The detailed chart
On pressing the chart and holding, the open, high, low and close prices (OHLC prices) can be seen for each security. You can check the OHLC data on each day (or any other time period) by pinpointing a different day (or time). To disable the OHLC figures, simply tap on the screen once.
On the bottom left, you will notice a small right arrow icon. It is extremely important as clicking it will bring out an assortment of indicators that can be applied on the chart. Once applied, the indicator bar can be closed by clicking the same icon (now a left arrow).
If the Angel One chart is getting too cluttered, you can also switch to the Trading View or ChartIQ chart directly by clicking on the Trading View/Chart IQ icon near the indicator arrow icon.
With Angel One, Traders can get the best of both worlds -TradingView for its coverage on Indicators and ChartIQ for precision on Candlestick movement. You just have to go to Settings in the Account section and choose either of the two based on your needs or preference.
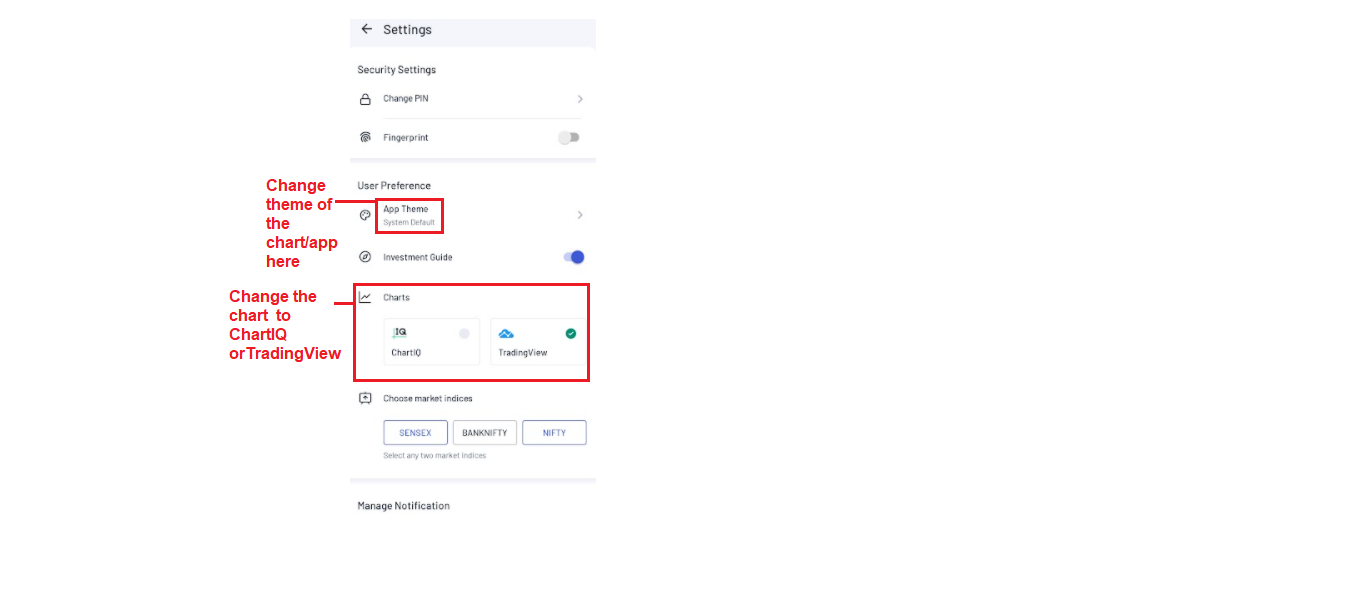
Fig 3: Changing Chart Settings
Before investing in stocks, you should read up adequately about fundamental analysis and technical analysis, so that you can better understand the various data points mentioned in the following sections as well as comprehend the various reports that Angel One regularly releases regularly.
The new Angel one charting experience gives the highest degree of the following qualities to the trader –
This, and a lot more, are waiting for you at Angel One’s cutting edge advanced Super App. Download the app and open a demat account with Angel One today to experience the next generation of fintech innovation!
Published on: Dec 2, 2022, 8:36 PM IST
We're Live on WhatsApp! Join our channel for market insights & updates

Get the link to download the App

