
Being informed about what one is paying for and what underlying charges are being incurred is a mechanism in itself to be transparent in order to ensure the proper flow of funds. But how can one keep track of it all with a simple click? We, at AngelOne have got that covered for you.
Transparency of the highest level is our promise to you. Be that as it may, going through multiple spreadsheets just to pick a particular transaction or duration to understand the fees involved can be strenuous. Well our DASH simplifies it for you. DASH encapsulates three major components as part of the user’s post trade activities.
This tool gives you details about what you paid and why you paid as part of your trading activity. It not only gives a summary of fee & charges levied for each individual trade but also for a specific date and duration like 7/15/30 days up to 90 days via the custom option.
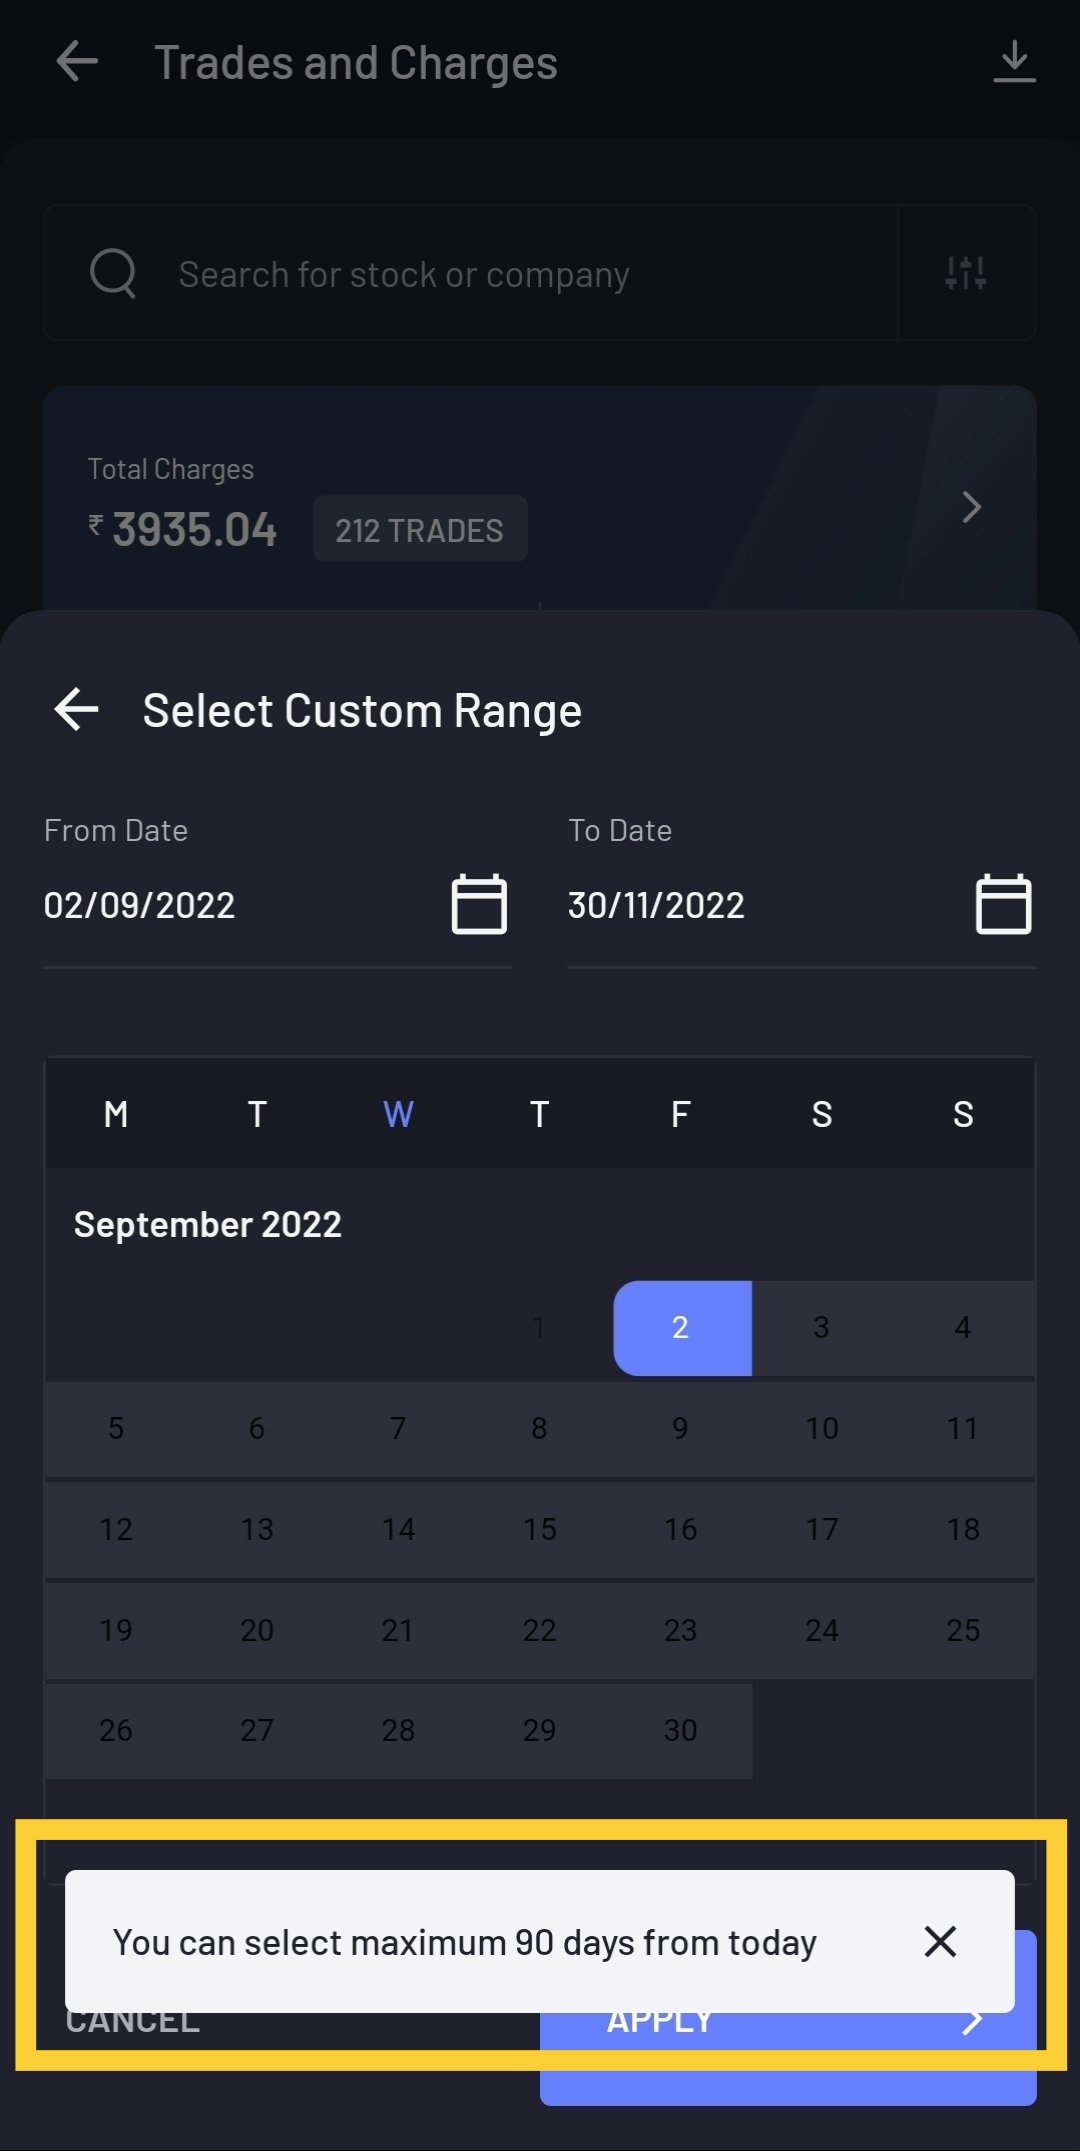
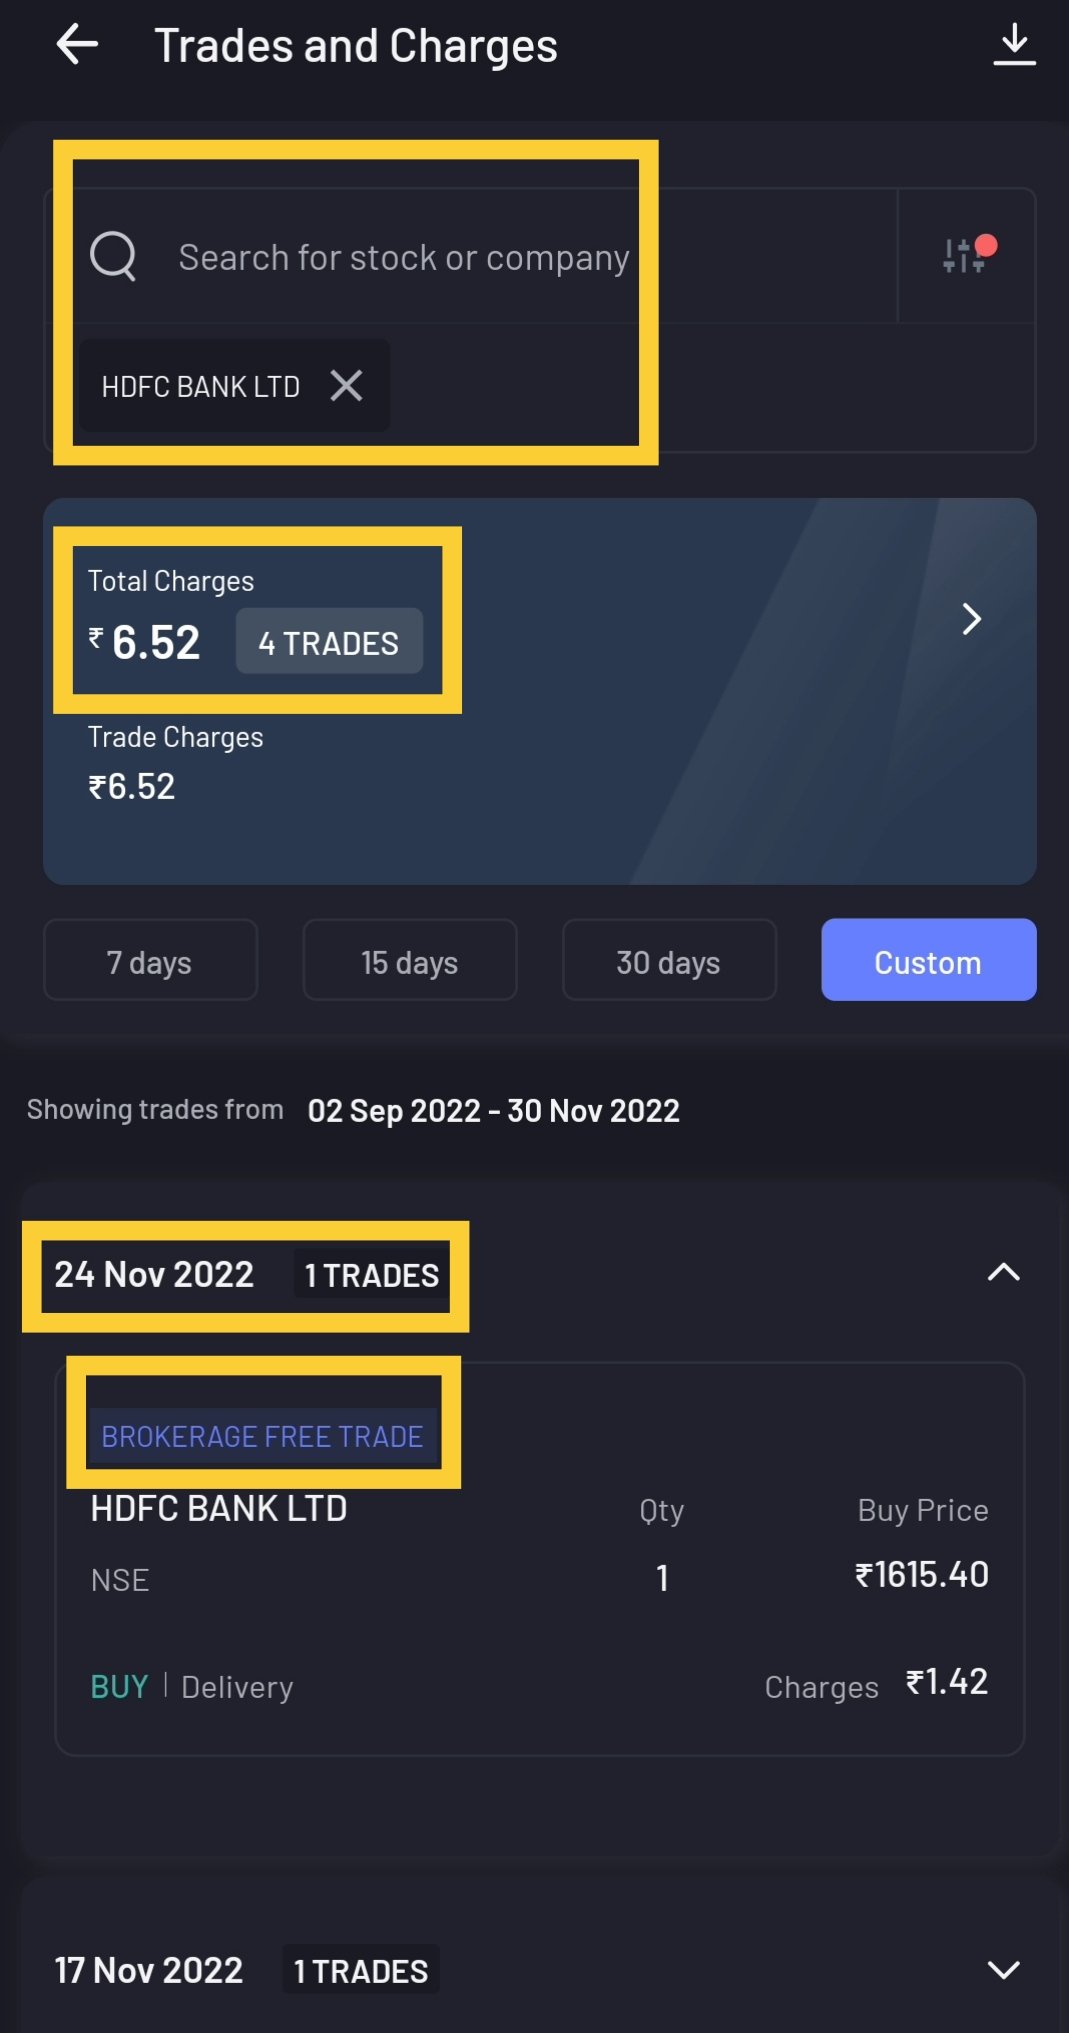
The maximum date range a user can look up for the list of trades punched in, and the corresponding trade charges is up to 90 days as shown in the above snippets. The user can also further expand each day to deep-dive into each transaction performed for that day and their respective incurred charges. This enables the user to randomly pick any transaction of their choice and understand it in detail. We have also provided a hyperlink that redirects to our website should a user require a more in-depth picture of the different charges and their fees.
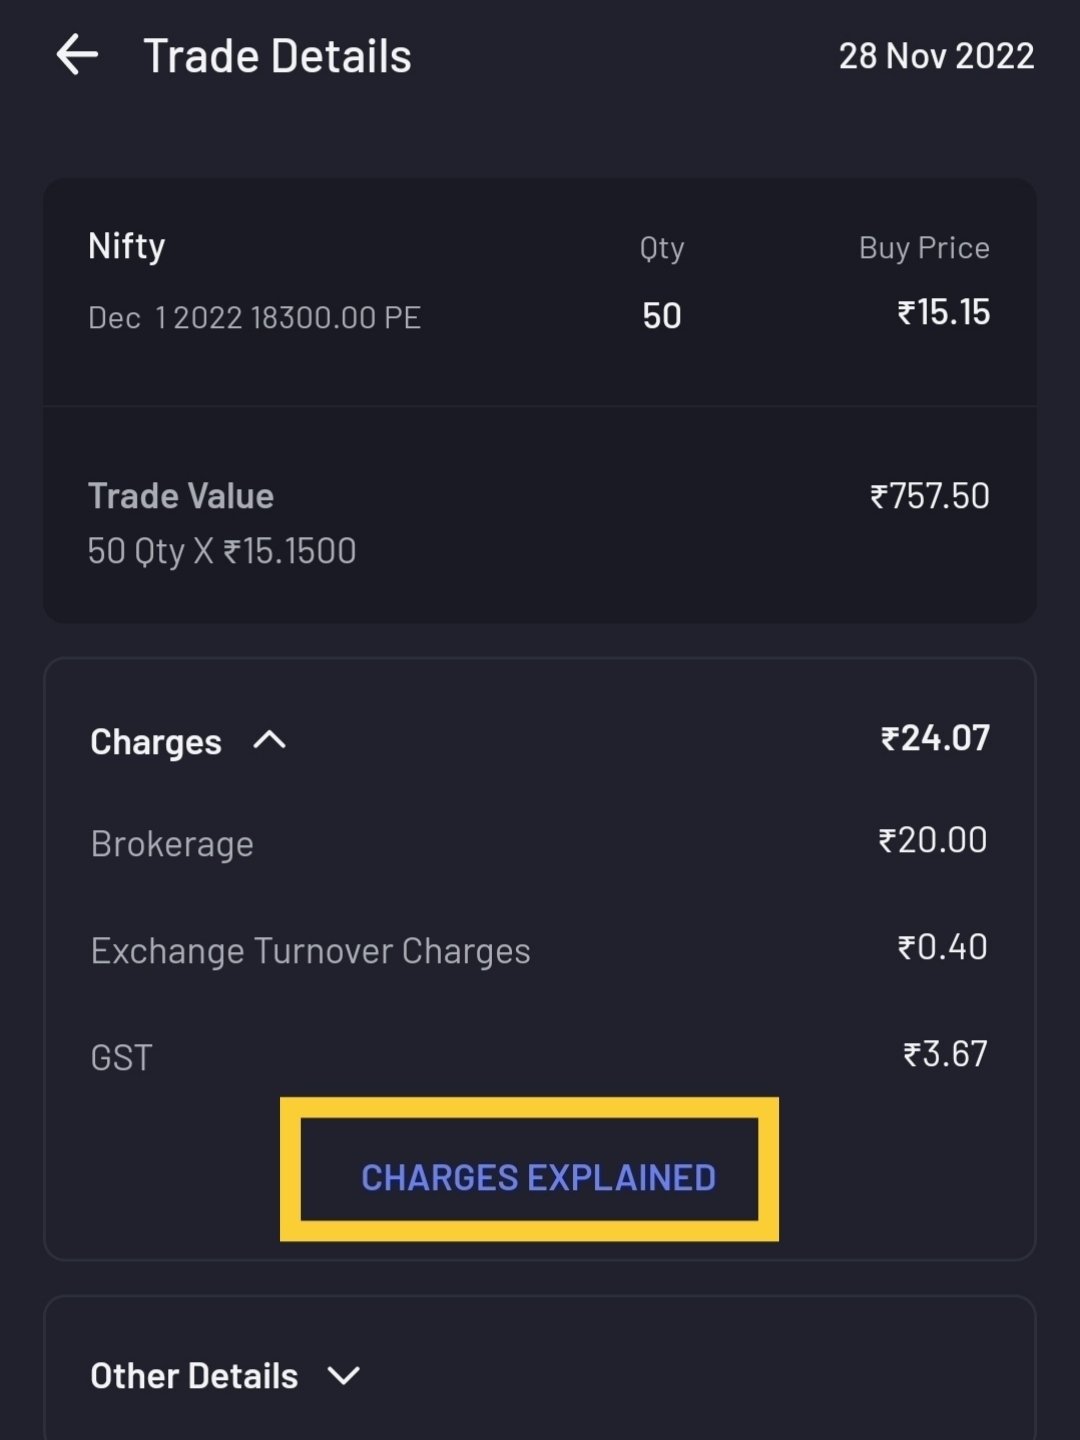
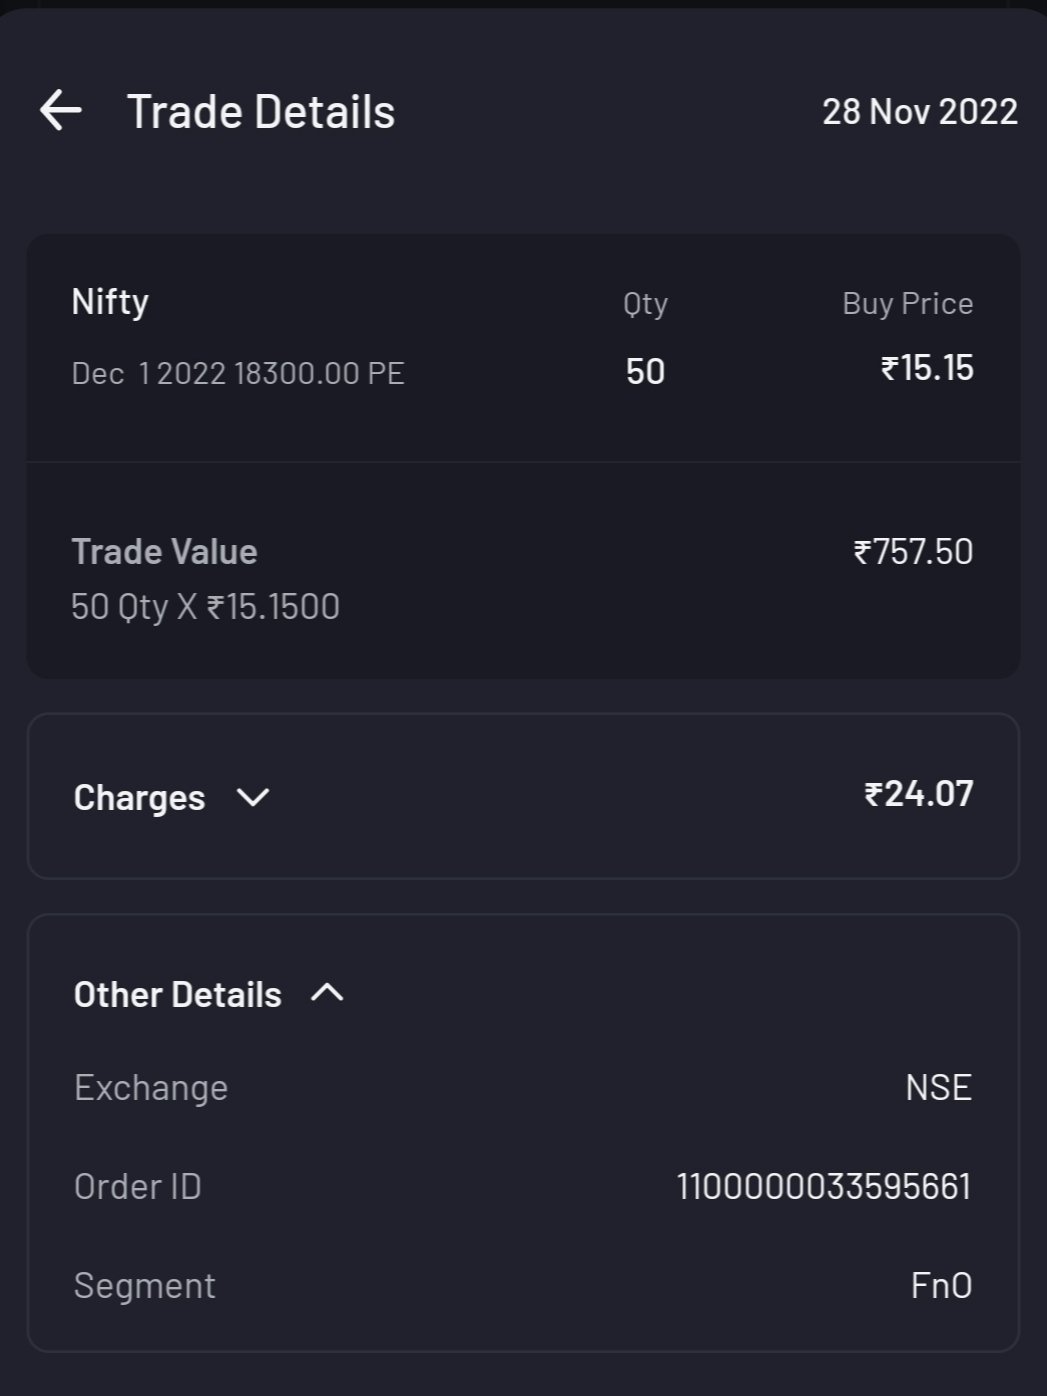
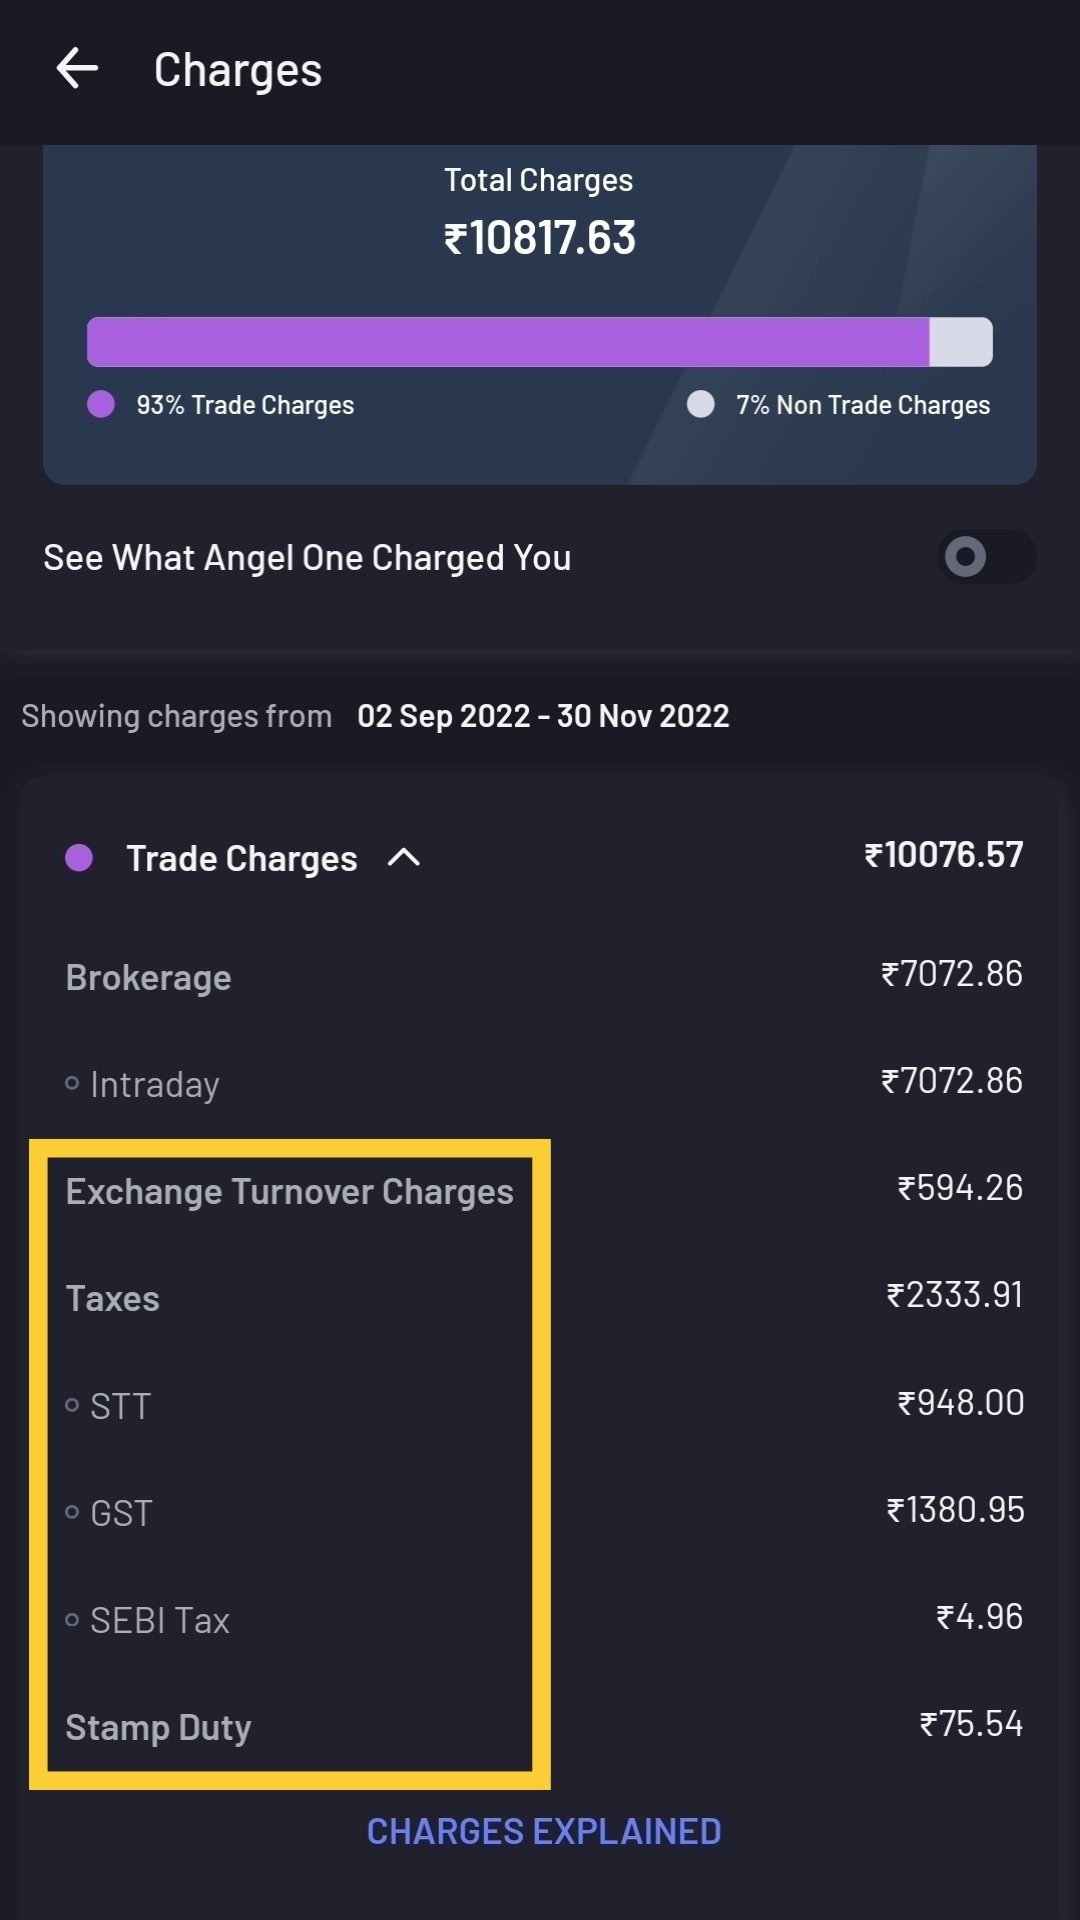
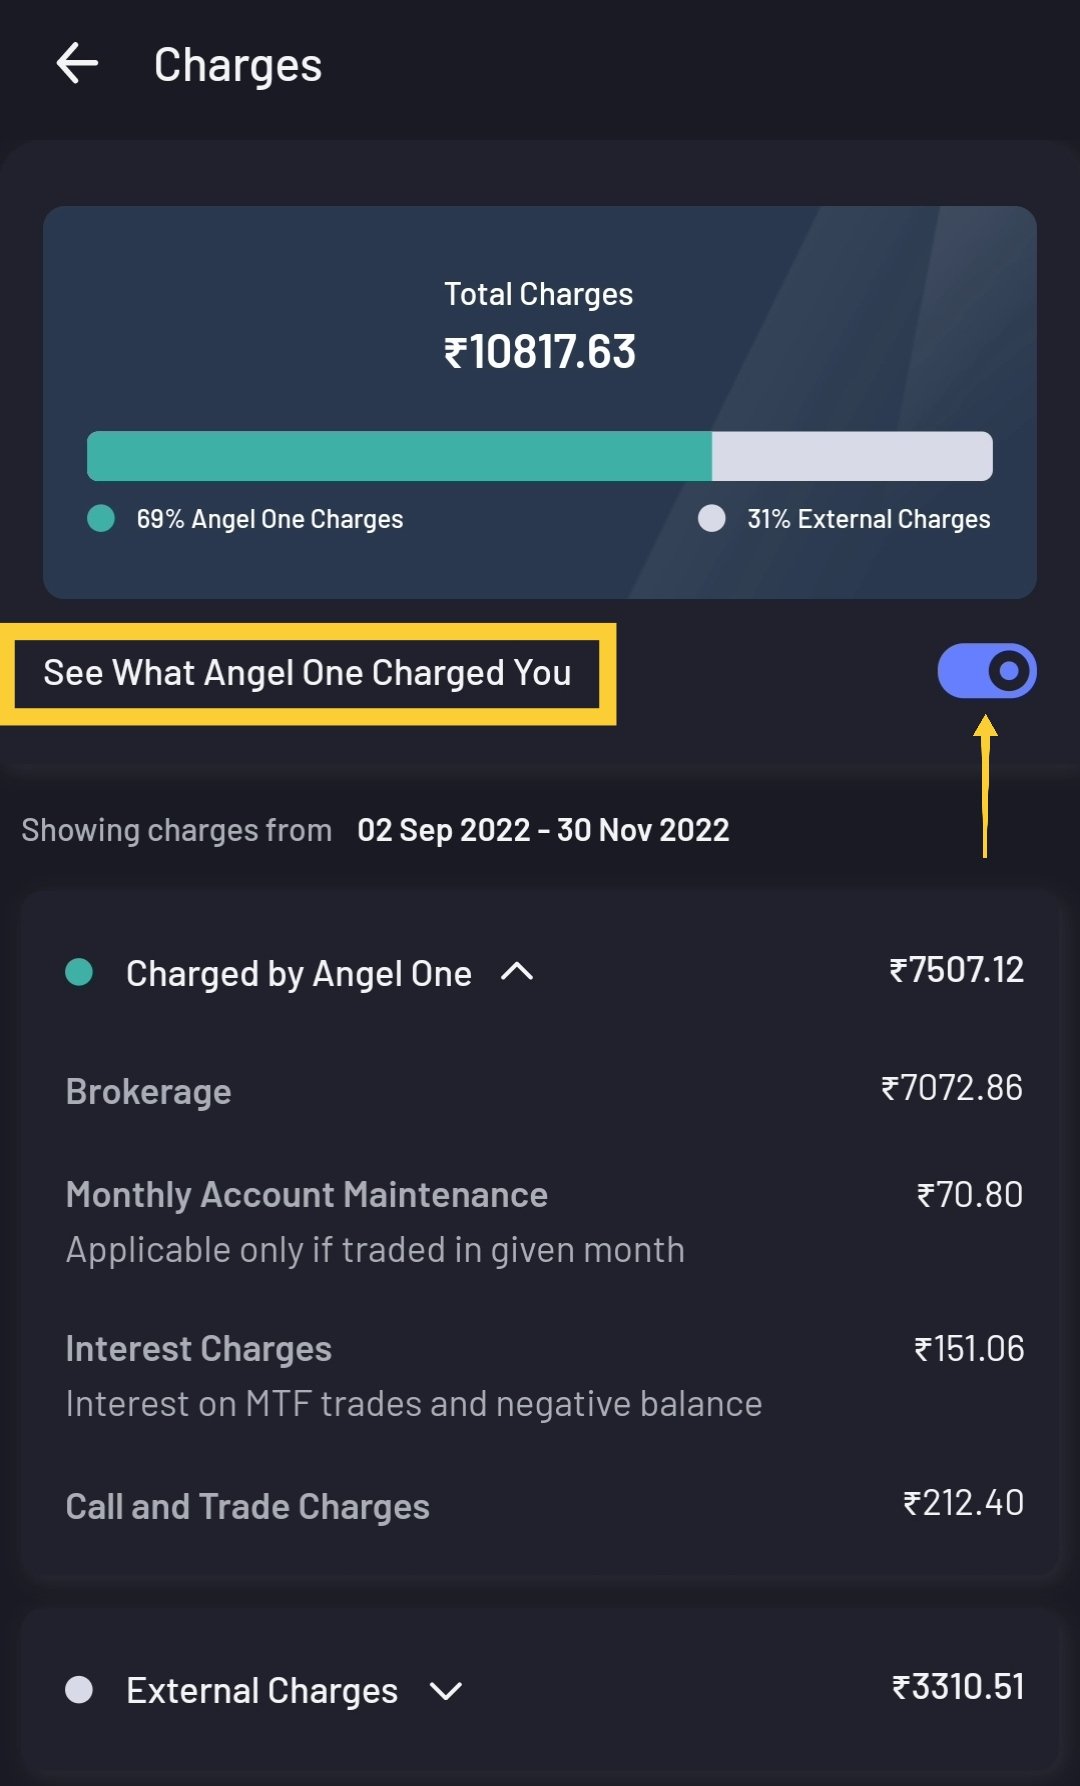
Each trade involves the user (you), the financial instrument (share/commodity), the platform i.e. us isn’t it? Not exactly. There are more parties involved such as the exchange, the government, SEBI, the depository etc. So, we brainstormed a lot and thought to make information available for the curious lot to know their charges involving all parties of the transaction. Once a user clicks on the total charges pane card, they can further see the bifurcation of trade and non-trade charges. We have also simplified your viewing pane to show those charges which are charged by us as a platform. These 2 snippets outline the same:
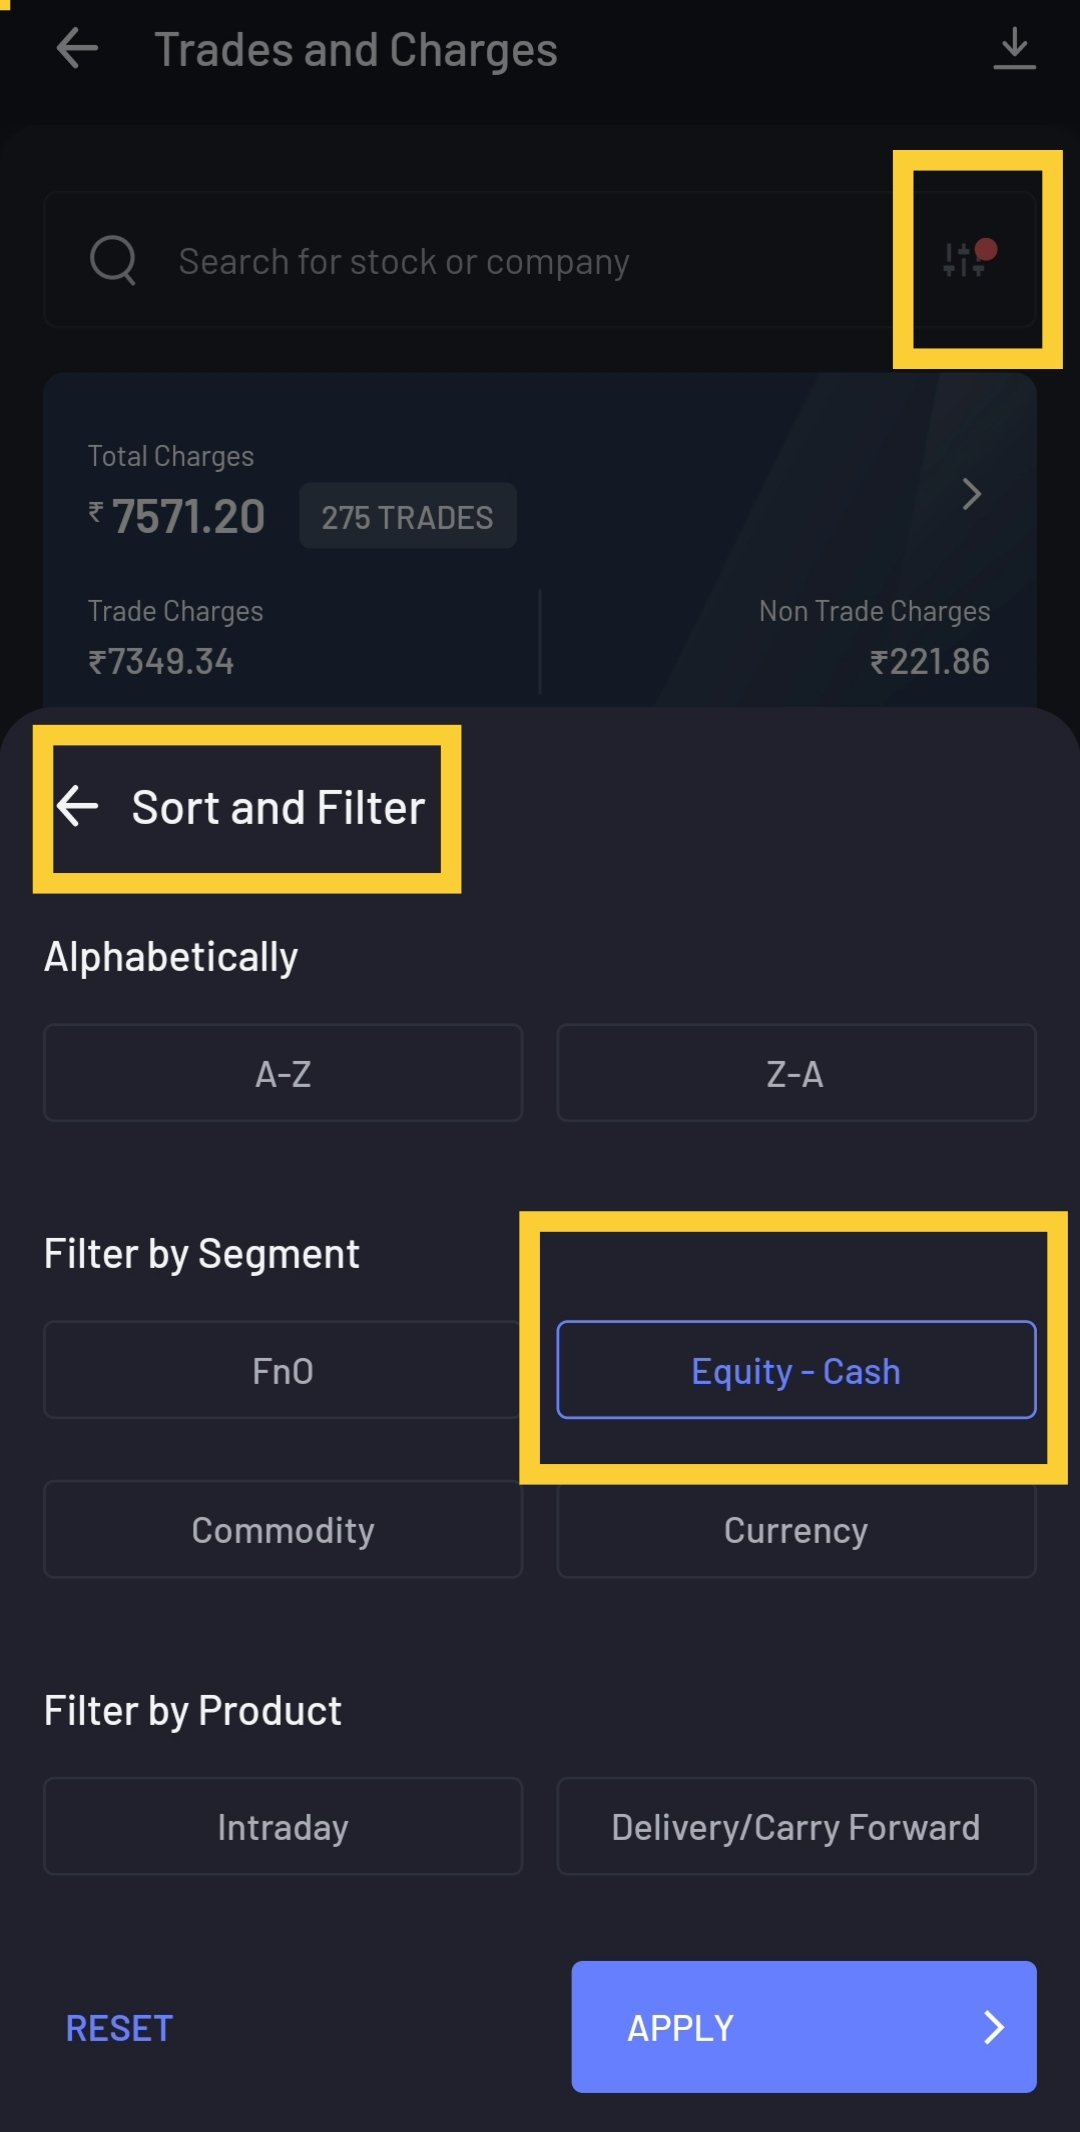
Our DASH feature provides the user view charges based on trade segments like Equity, F&O, Currency, Commodity and also filters out charges for intraday and delivery. The user can also look up a particular stock they traded on to know the segment charge for it. Here’s how it looks like:
Profit & Loss
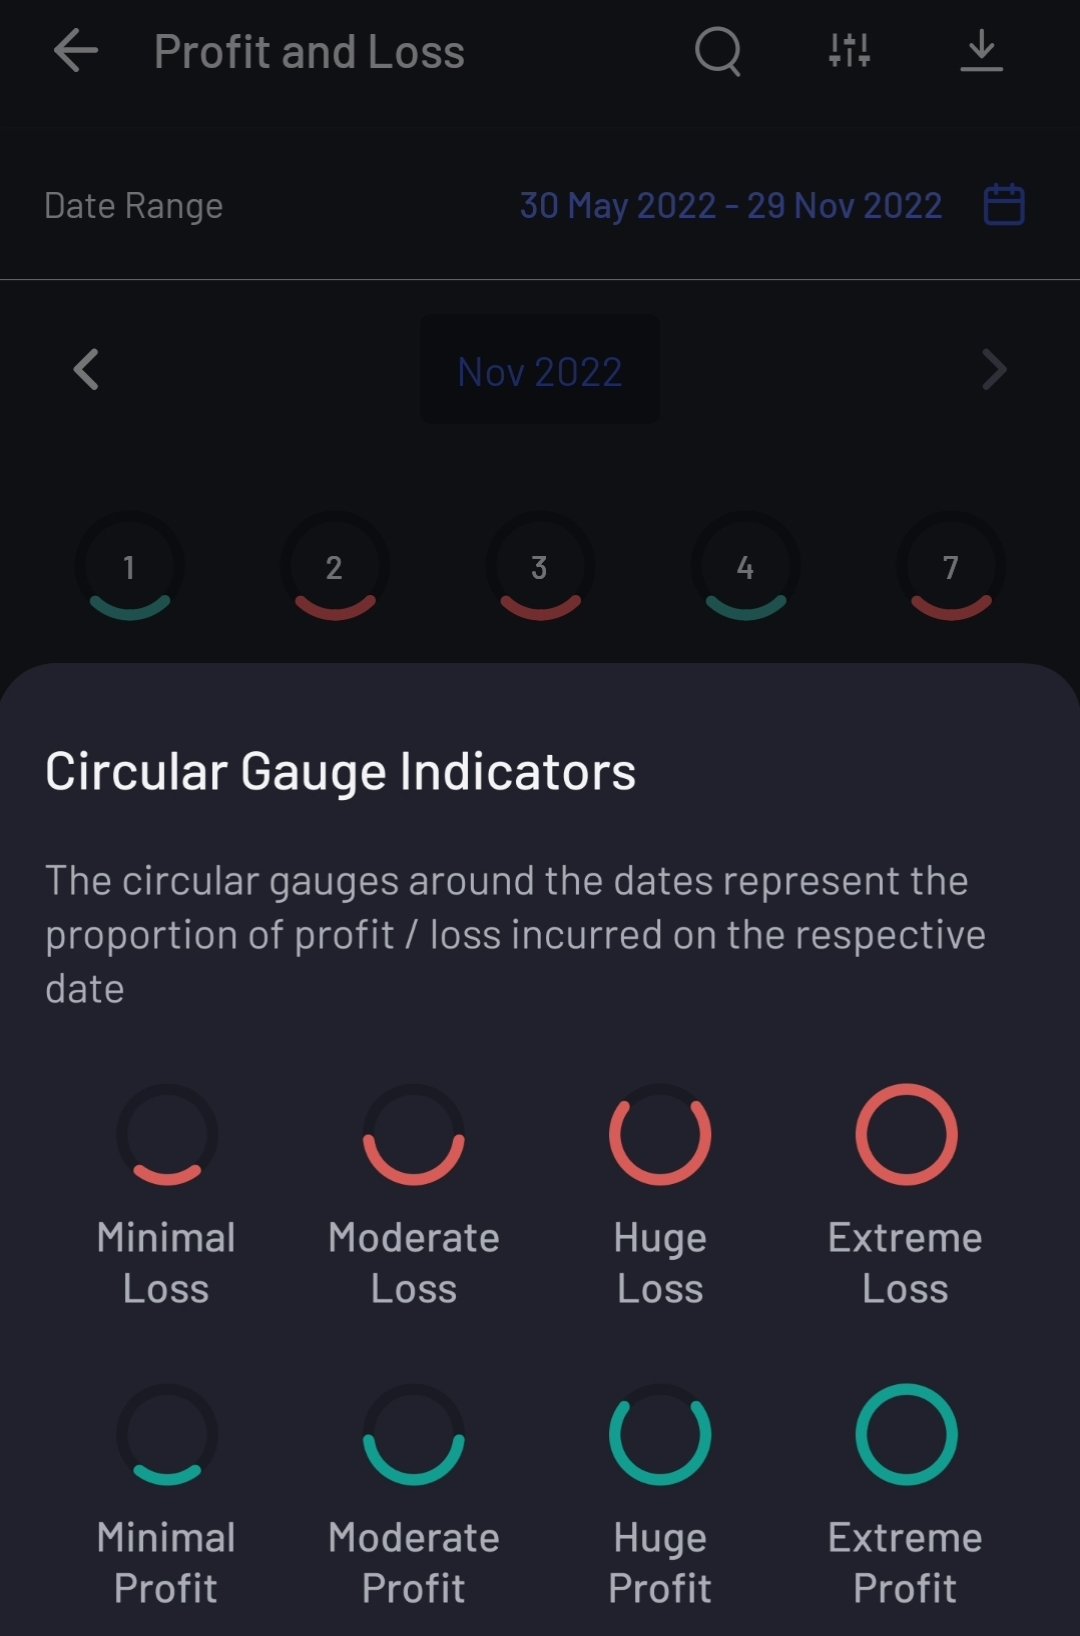
This is a powerful tool that we formulated under DASH to give the user a very good visual understanding about the profit & loss in the last 6 months. We have visually curated this section in such a way that a user can look up the 6 months and understand which months were profitable and which ones were not. This is provided in the form a green and red colored circular gauge denoting profit & loss respectively, and extends to date wise view in each month. We can also further click on a specific date to get insights based on the color gauge to find out the profit/loss made on that date.
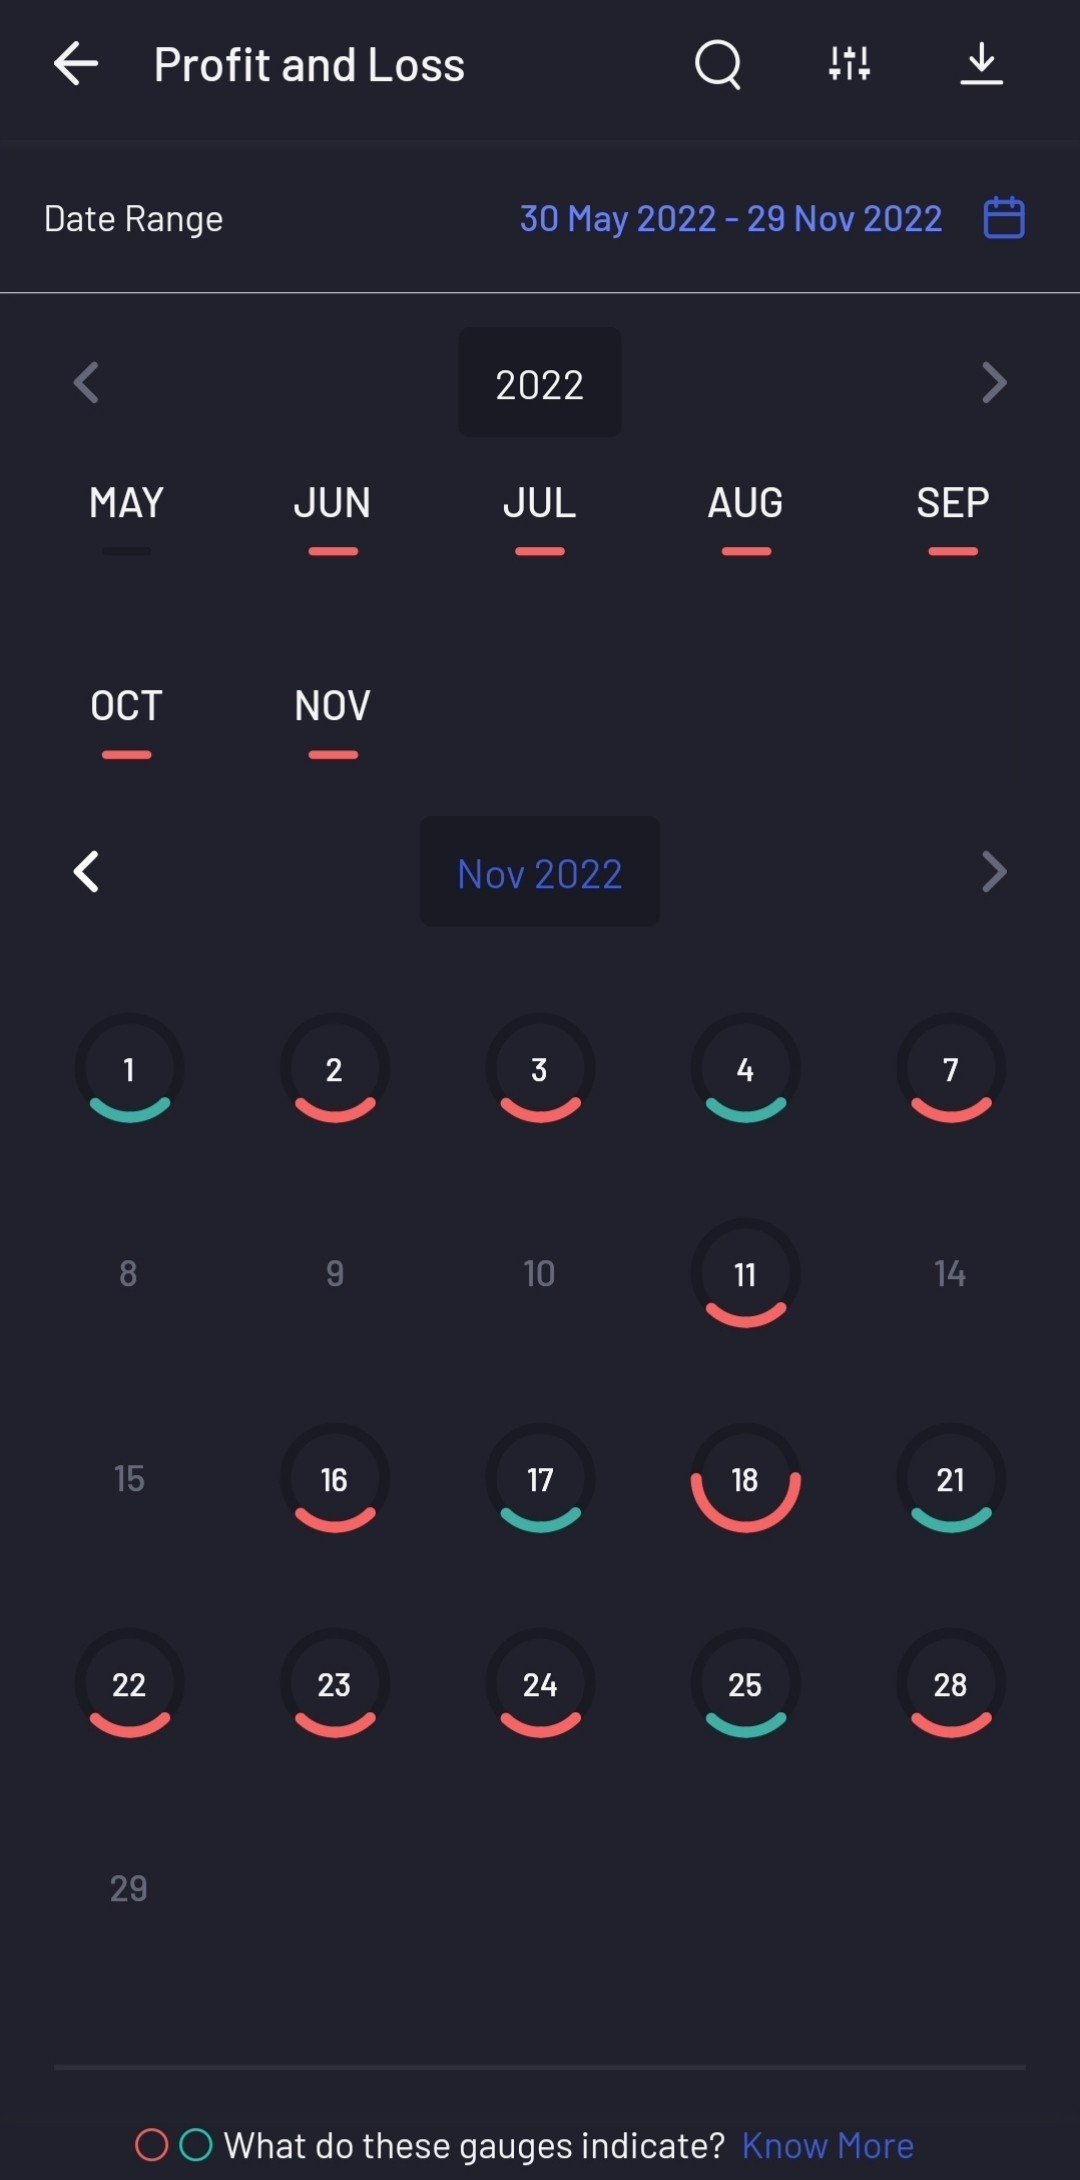
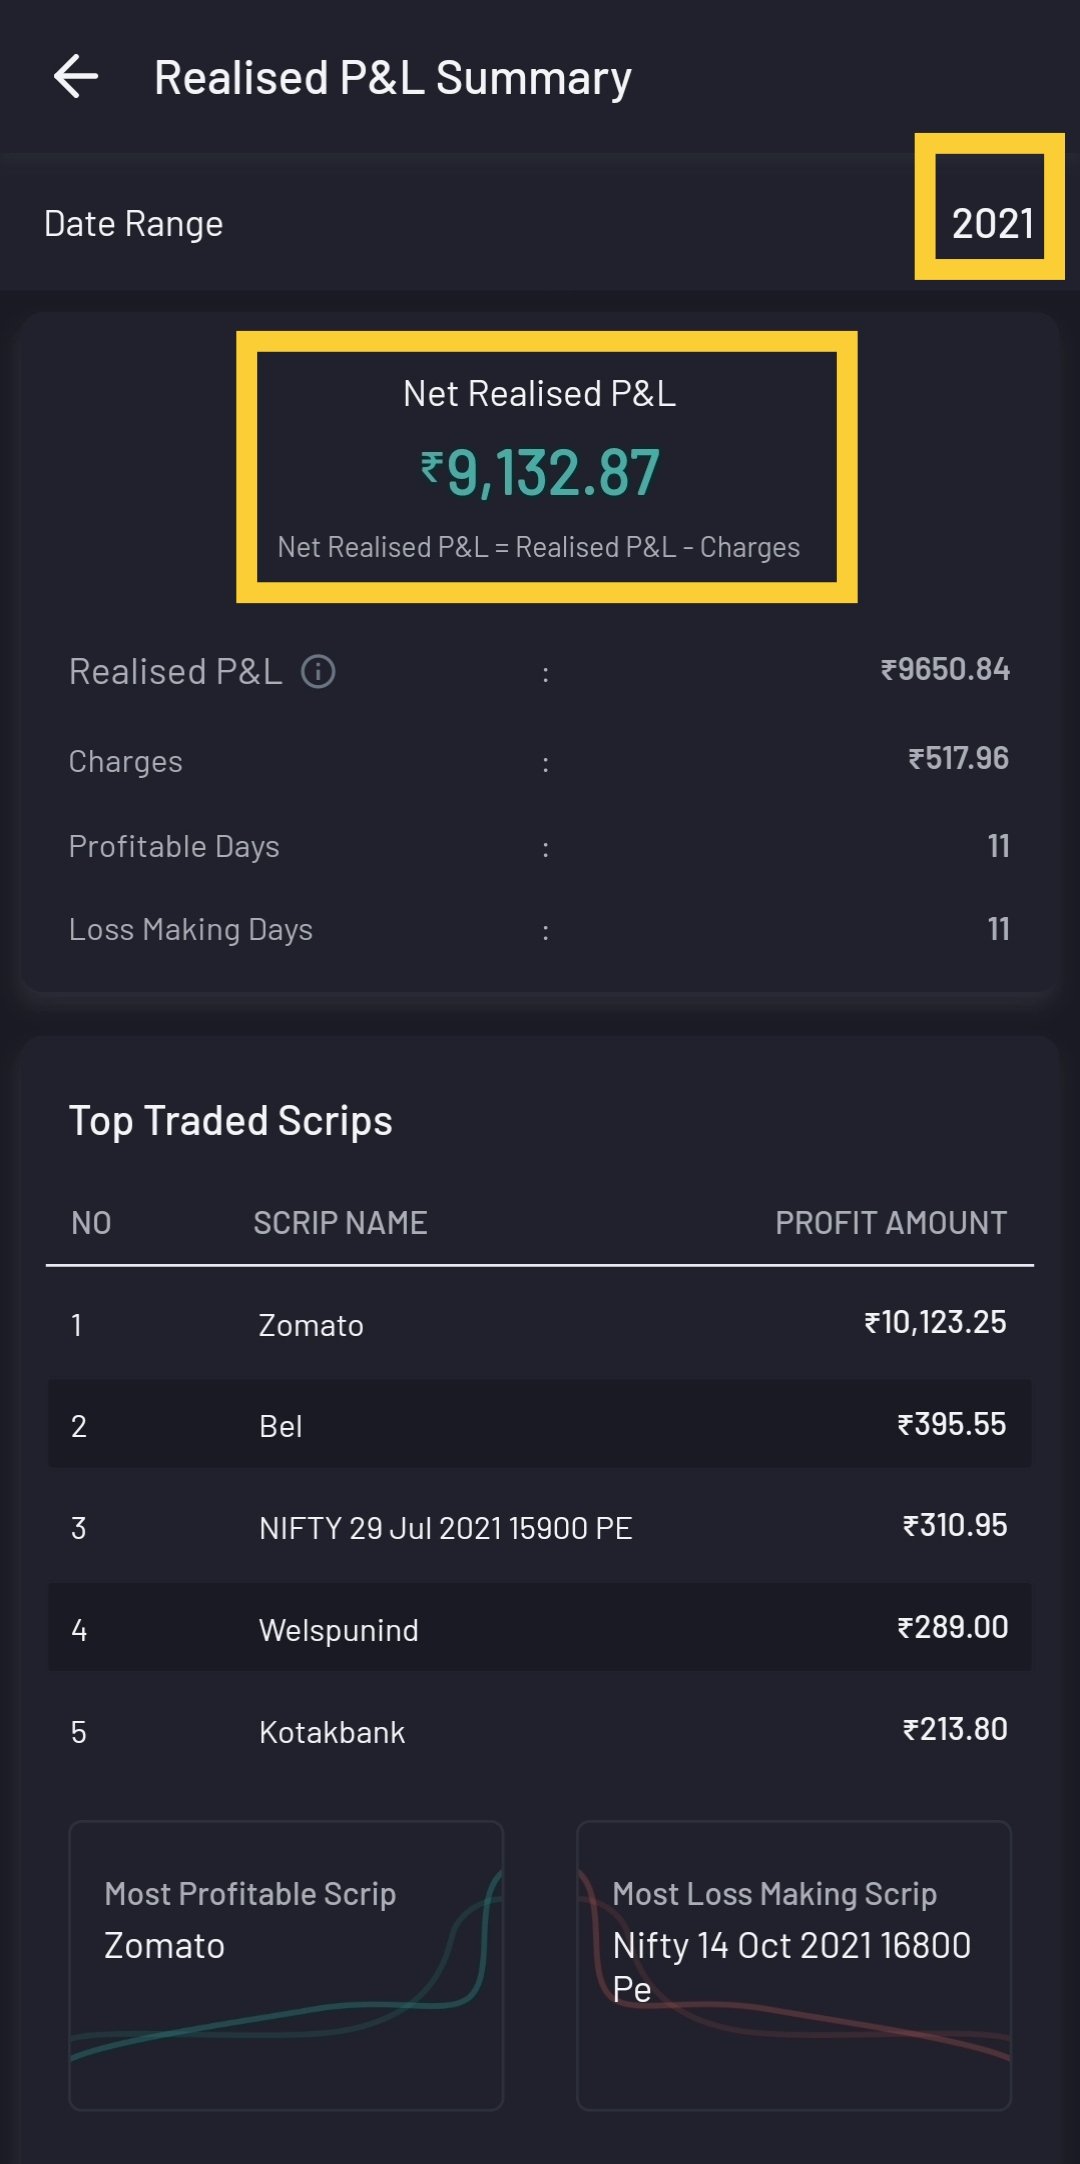
We can also have a year wise view to understand the profit/loss making months and expanding the year further will reveal the P&L summary to more details such as number of profit/loss making days, most profitable/loss making scrip etc. This way we can get information up to the prior 2 years to the current date.
d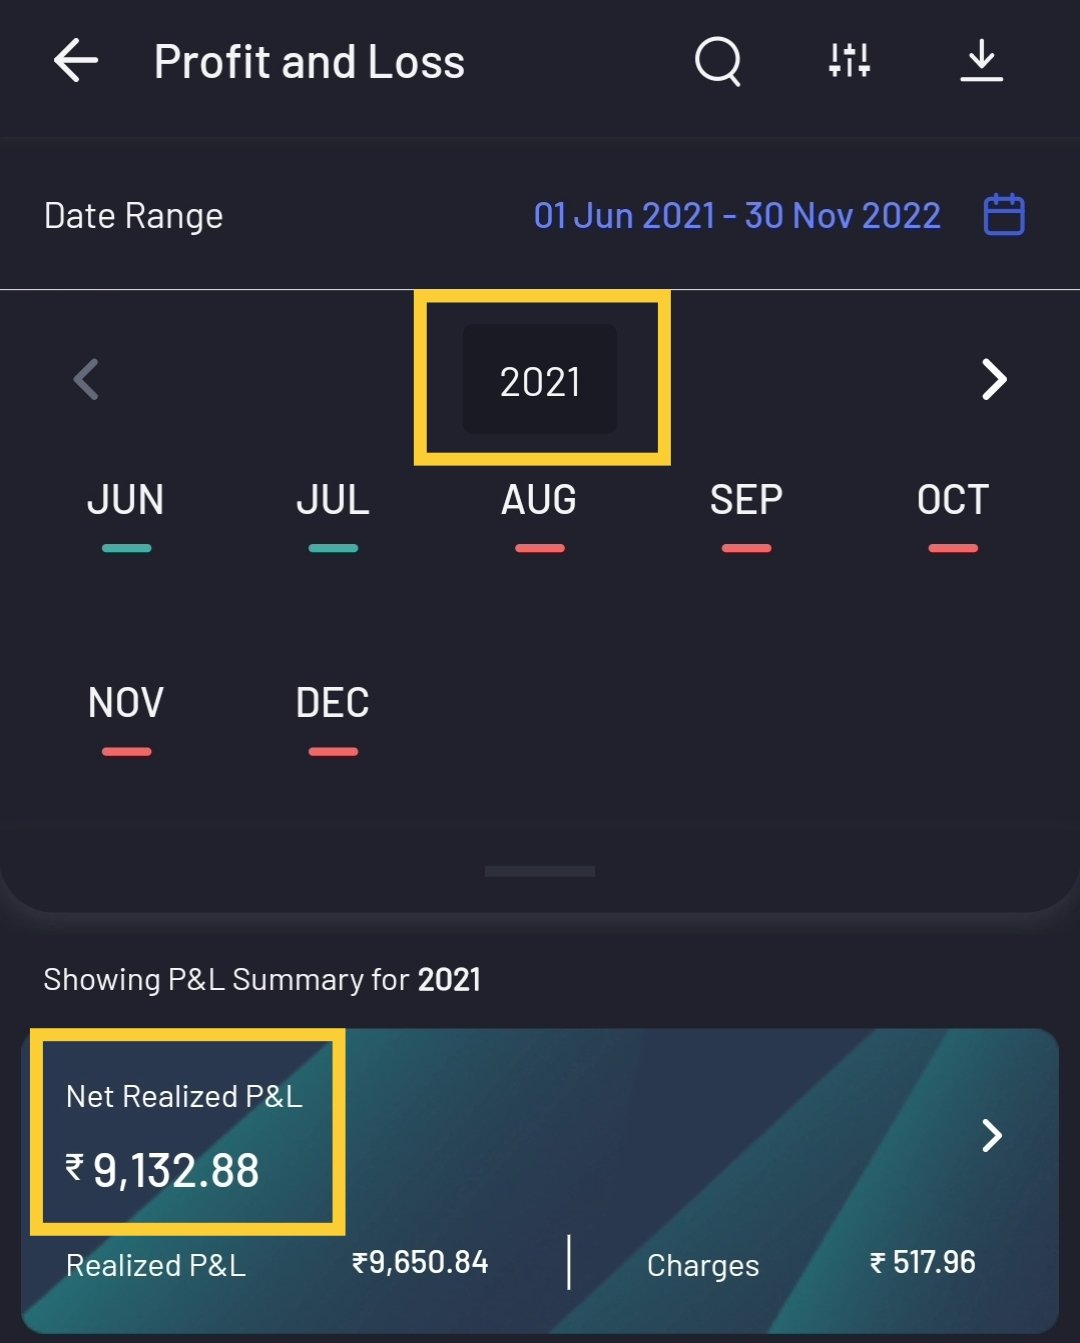
Similar to trades & charges, the user can filter based on segment type and product type for the desired calendar range to understand their performance on equity or F&O for a given time period. This tool also enables P&L statement download for desired filters and time period.
Statement
It is another revolutionary tool where we completely refined the transaction ledger. The time period spans from days/months/YTD to 3 financial years along with the usual custom date view. We have also enabled chart functionality that shows the movement of your funds over the course of time to make the data more granular or aggregated per your choice. The trades executed have been simplified where we provide subtitles (journalising statement). By selecting a particular trade we get a condensed version of the contract note citing overview of no of traders, segment type, transaction charges, NSV etc.
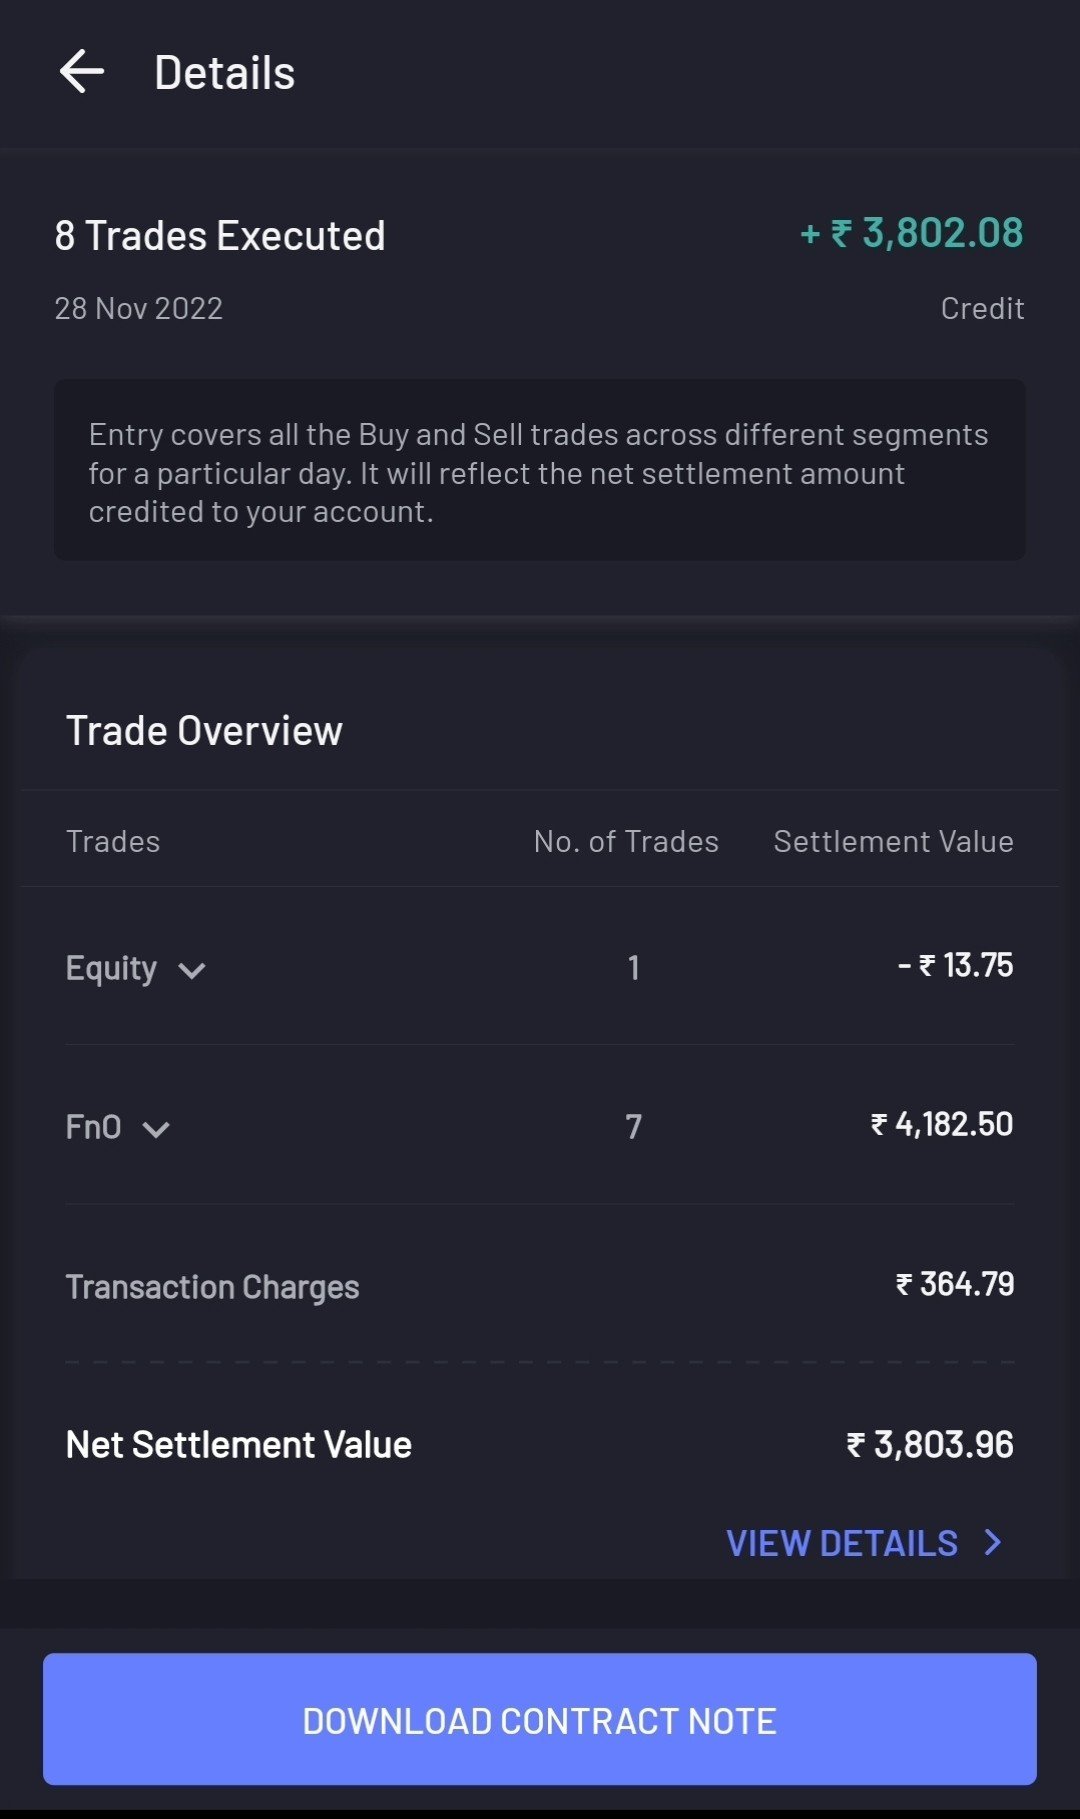
We have also facilitated the option to download the contract note that helps the user to have an in-depth analysis. We categorized the transaction entries to cite quarterly payouts, showcase fund credits, trades, pledges, charges etc. The statement tool gives a greater understanding of what came into your account, what went out of your account, and all the details pertaining to transactions done with AngelOne.
In this age of technology where we have to comb through enormous amounts of data to obtain what we are looking for, transparency becomes a key ingredient for our users to see where, how, and in what way their funds are flowing while performing various functions on our platform. Through DASH we aim at keeping things simpler and effective by giving power to our users to not digress from the minute details, and create a lasting impact to their user experience.
If the above innovations excite you, open a demat account with Angel One today and start a new investment journey!
Published on: Dec 1, 2022, 7:56 PM IST
We're Live on WhatsApp! Join our channel for market insights & updates

Get the link to download the App

