Finding it hard to identify a trend out of dozens of confusing candlesticks? The Angel Trend Tracker is here to show you which way the market is moving!
If you are a trader or even an investor who likes to use technical analysis, then you probably know that it is challenging to identify a general trend from a series of disparate candlesticks. This becomes especially difficult when the candlesticks do not show any clear, secular trend. In such cases, you need a tool that can help you navigate through a series of candlesticks in one glance and help you understand the underlying market sentiment in a matter of seconds. This January, we bring to you exactly that tool in the form of the Angel Trend Tracker!
What’s New?
You can now apply the advanced Angel Trend Tracker on your chart. This is not just any standard indicator. It is offered specifically by Angel One in order to help users, especially traders, identify the general trends in an asset’s price movement.
What Is Special About the New Angel Trend Tracker?
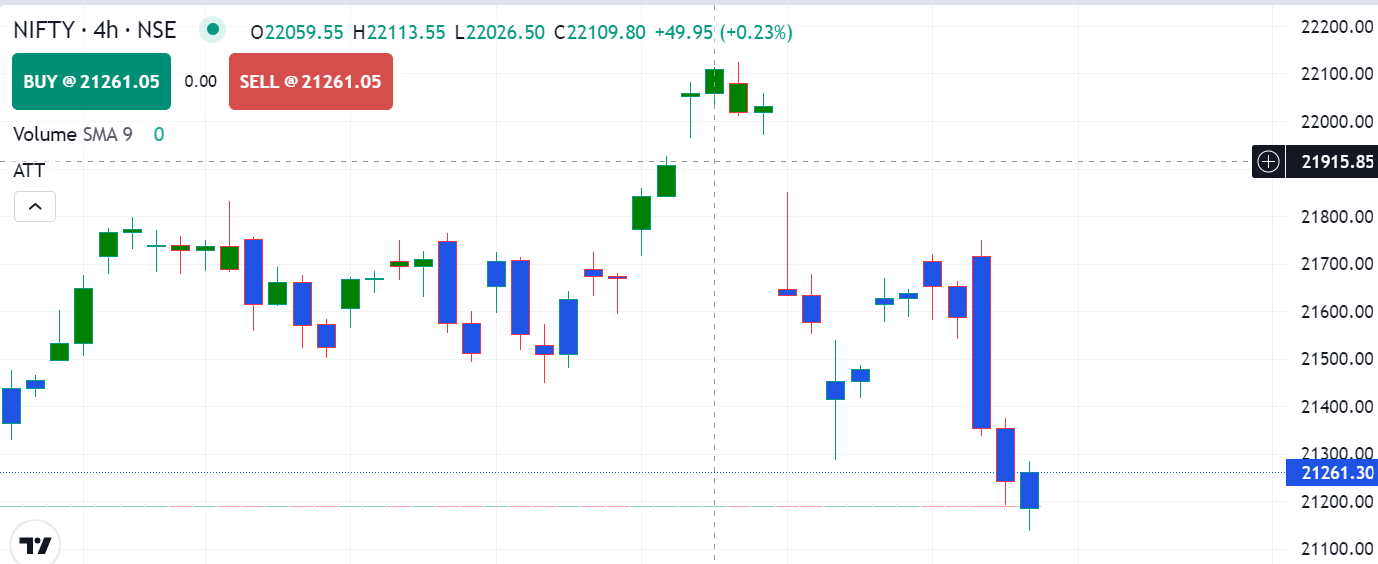
- The Tracker, in the form of a green or red borderline wrapped around a candlestick, will signal to you the general bullish or bearish trend that is present in the market, regardless of temporary increases and decreases in price.
- A single look at the indicator will be enough to identify the trend, so no need to spend hours going through multiple candlesticks and subtrends over different timelines.
- It helps you observe how long-term and short-term price movements influence each other.
- It is offered only on the Angel One Charts.
How To Use the Tracker?
In order to apply the tracker, simply:
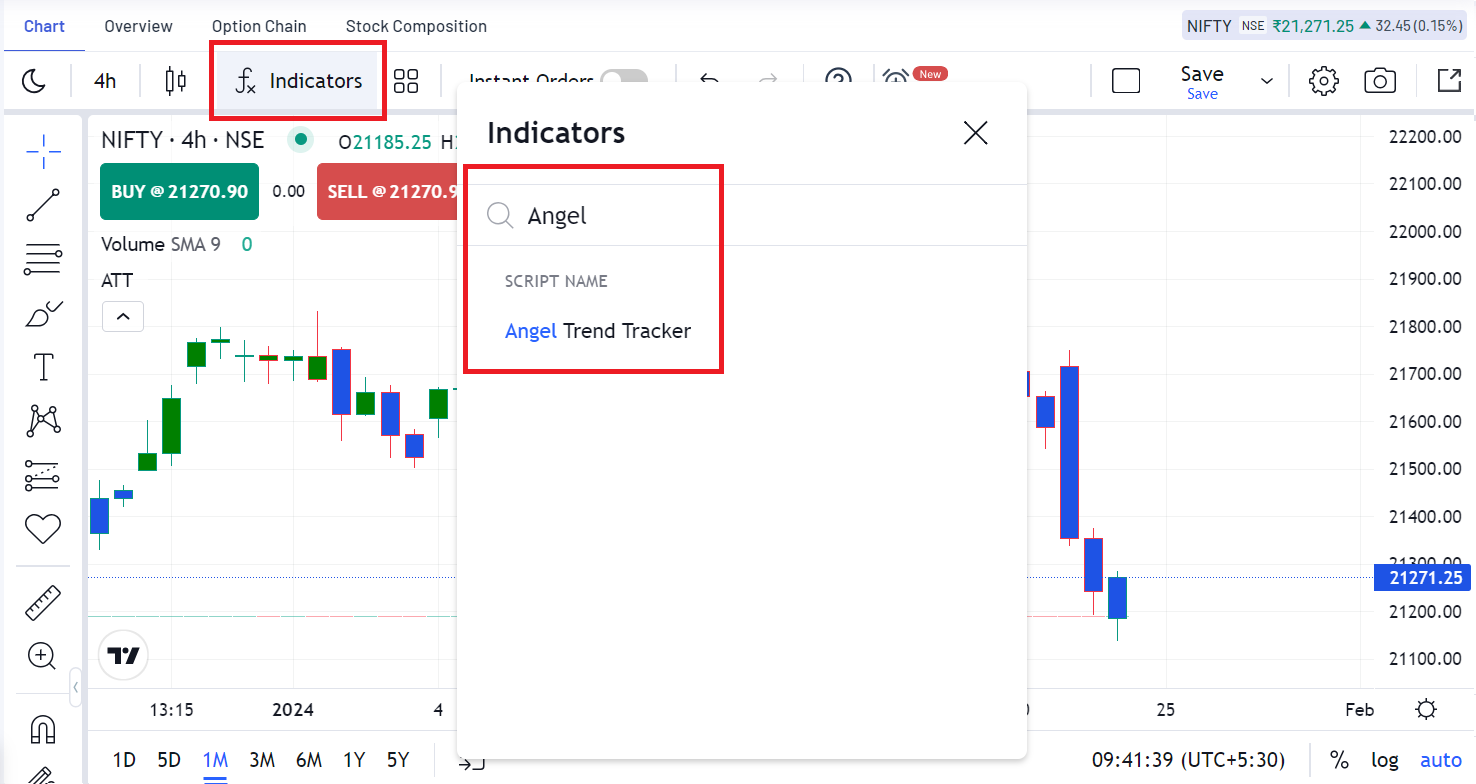
- Open the Angel One Chart.
- Click on ‘fx Indicators’ on the top and choose ‘Angel Trend Tracker’ from the list.
Now comes the second and more important part, i.e. how to interpret what you see on the screen.
The following points will help you comprehend exactly how the Angel Trend Tracker works:
- Once you open the trend tracker, you will see a candlestick chart pattern on the screen. The only difference from a standard candlestick chart will be that the candles showing price drops will be in blue instead of red.
- Now, each candle will be bordered by lines in either green or red. This border line will show you what the general trend is.
- A green borderline means that the general trend is bullish while a red borderline means that the general trend is bearish.
- Sometimes, a green bullish candle may be bordered by a red bearish borderline. This means that while the price itself increased during the timeline of that candle, the general trend is a bearish one. In other words, it is safer to assume that a bearish trend is in play despite the momentary increase in price. The opposite can also happen, i.e. a blue bearish candle is bordered by a green bullish border.
- A trend may also get reversed. For example, a candle with a bearish red borderline may be followed by a candle with a bullish green borderline.
Basically, when you open the Trend Tracker, you can simply look at the borderline and know whether the general trend is bullish or bearish instead of having to look through multiple candlesticks.
Final Words
If this latest feature excites you, be sure to follow the Angel One blog and Community page in order to stay updated with our latest feature releases. Also, remember to update your Angel One iOS or Android app to the latest version.


