
“It’s not always that we need to do more but rather that we need to focus on less.”
– Nathan W. Morris, author and finance expert
Many first-time investors find it hard to grasp the macro-trends in the market as they are too busy trying to assess the micro-changes that are happening in their portfolio every minute.
Here at Angel One, we believe that even the smallest discomfort of the trader is a cause for concern. With this in mind, we have come up with a whole new range of advanced features that will revolutionise how an average investor tracks his/her portfolio on a trading app.
Let’s take a look at them in detail.
Efficiently navigate through the most complex portfolios
In the new version, the user can easily spot the overall details of their portfolio on the homepage itself, where they can check their –
Thereafter, when you reach the Portfolio page, you will also find the option to download the portfolio data (through the downward arrow icon on the top right).
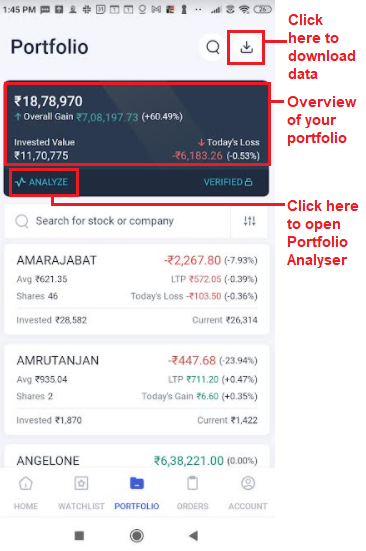
Fig. 1: The portfolio details – overall details are in the dark-colour box and individual scrips below it
Now there are two different formats available for the user in the portfolio section – the collapsed view and the detailed view.
The collapsed view (which is the default view) shows the basic facts about each scrip i.e. –
However, if the user is interested in knowing further details about the scrips, they can enable the detailed view. It will show the above details as well as additional information on each scrip such as –
Furthermore, while using the detailed view, the user will also be able to sort his/her scrips as per the day’s gains or losses.
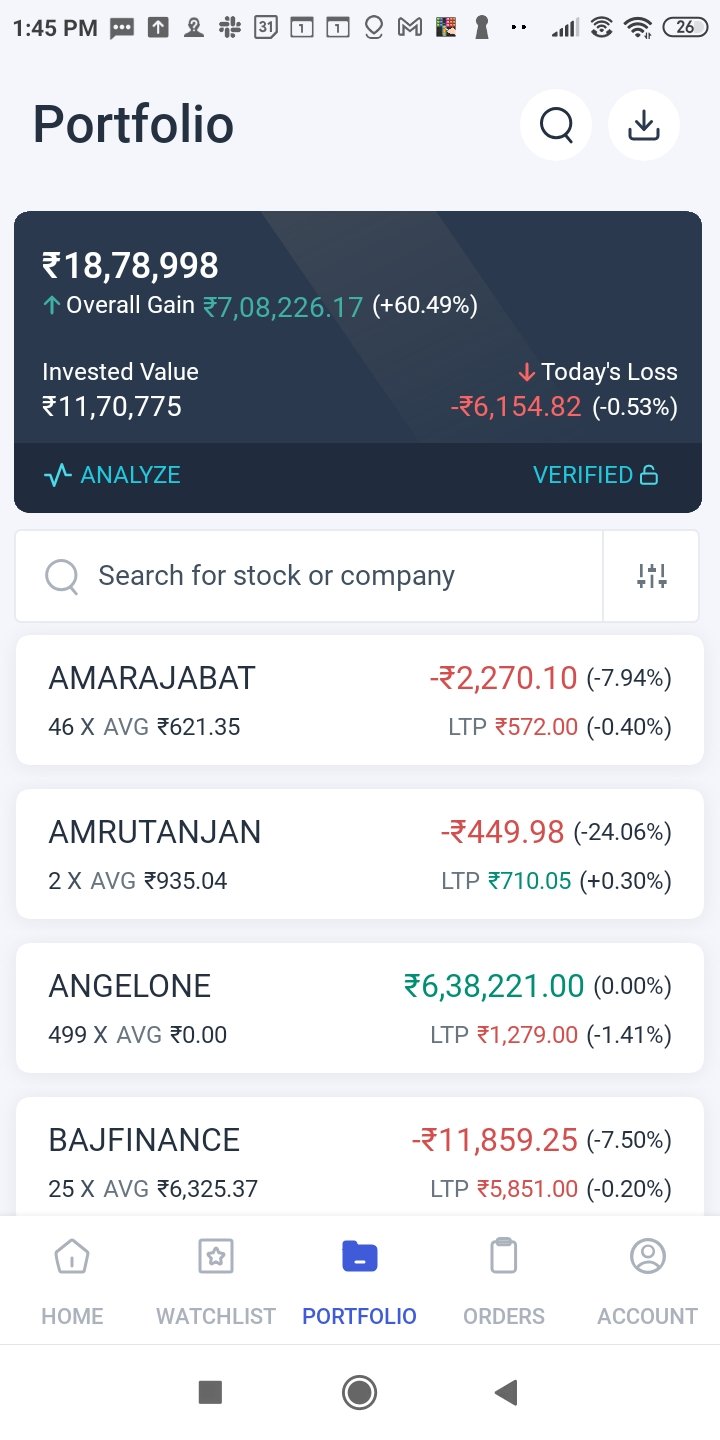
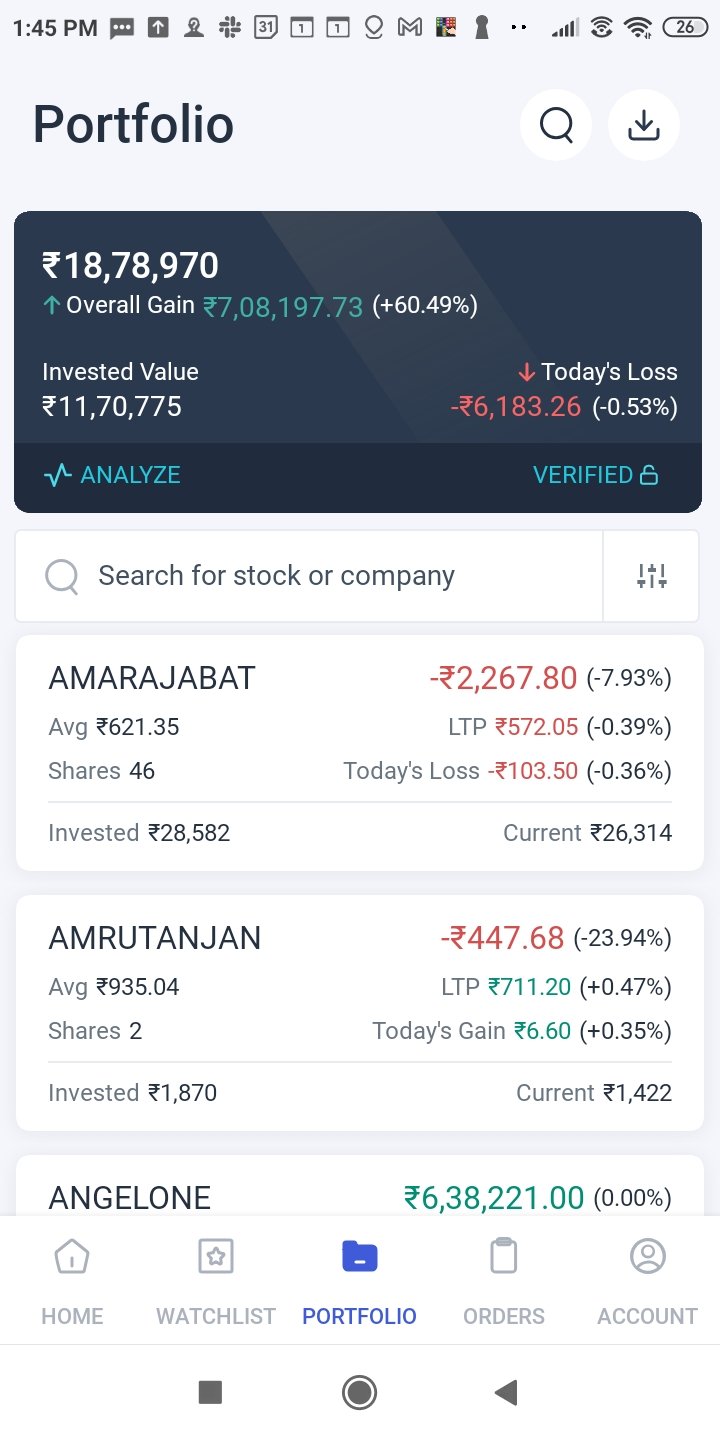
Fig.2: Collapsed View (left) and Detailed View (right). Click on the three vertical lines (or rods) right next to “Search for stock or company” to reach the “Sort by” or “Filter by” window, where you can enable the detailed view (as seen in the following figure)
How to switch to the detailed view
In order to switch from collapsed view to detailed view, all you have to do is click on the three rods menu next to the search bar – a window will appear where you will have to go to the “Sort by” section and activate the detailed view icon.
Note: The “Sort by” section will list all the variables by which your portfolio can be sorted, such as alphabetical order, LTP change etc.
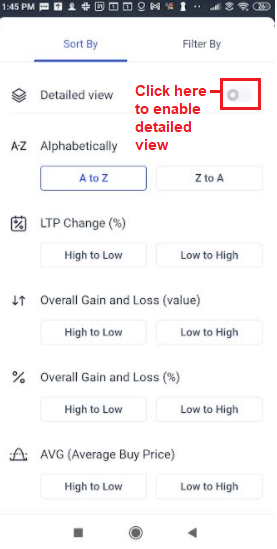
Fig.3: See the detailed view option
Benefits from this
The process of tracking their portfolio will automatically become much easier.
It’s a small but delightful change which will make users enjoy the trading process.
Portfolio Analyser – Empowering Beginners
Very often, novice investors miss out on diversifying their portfolio fearing their inability to track the various investments. With our latest upgrade we introduce the Portfolio Analyser which can help you identify below aspects of your portfolio –
The macro level analysis will be available to you through pie charts, bar graphs etc. that can be easily read and understood.
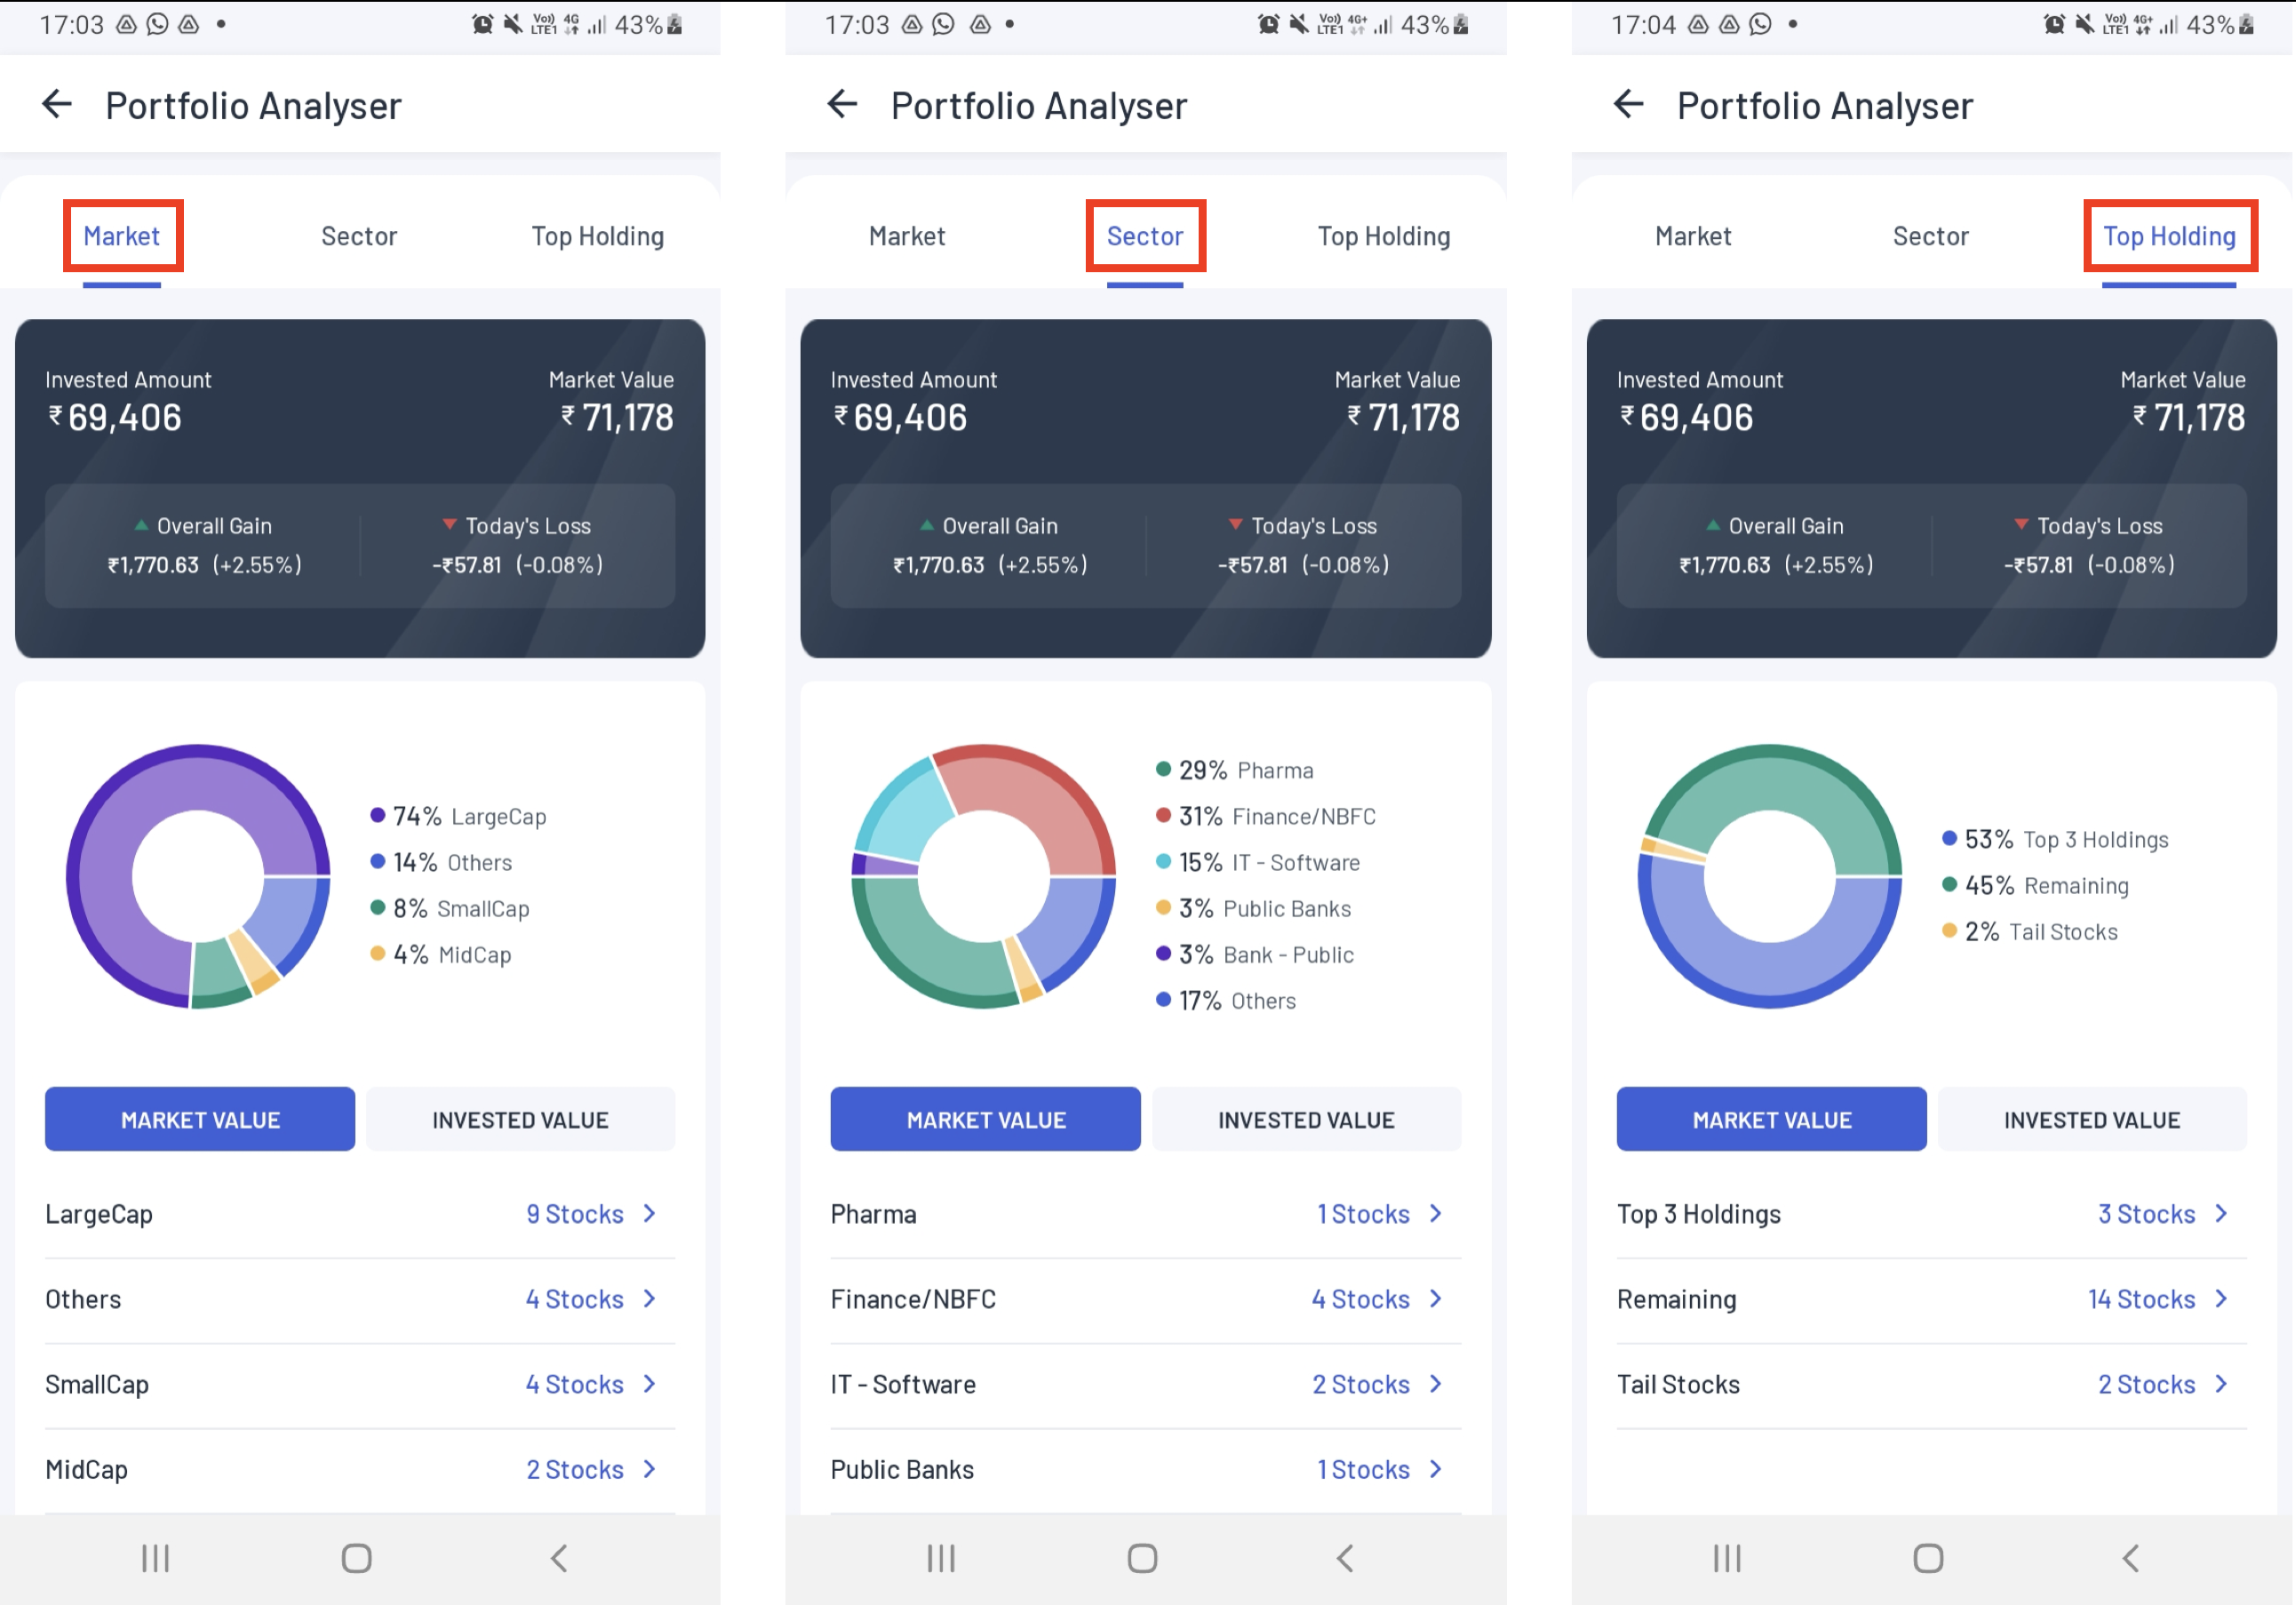
Fig.4: Portfolio analyser: Capitalisation-based analysis (left), Sector-based analysis (middle) and analysis of top holdings (right) – sections highlighted in red
Trade History and Dividend Earned
If you click on an individual asset in your portfolio page and scroll down to the bottom, you will see two new, innovative options that we have added – Trade History and Dividend Earned.
Trade History will give you the details of every trade you made on a daily basis along with the following data –
You can sort the above list based on the action (i.e. buy/sell) and the total amount involved in the trade by hitting the arrow signs beside these headings.
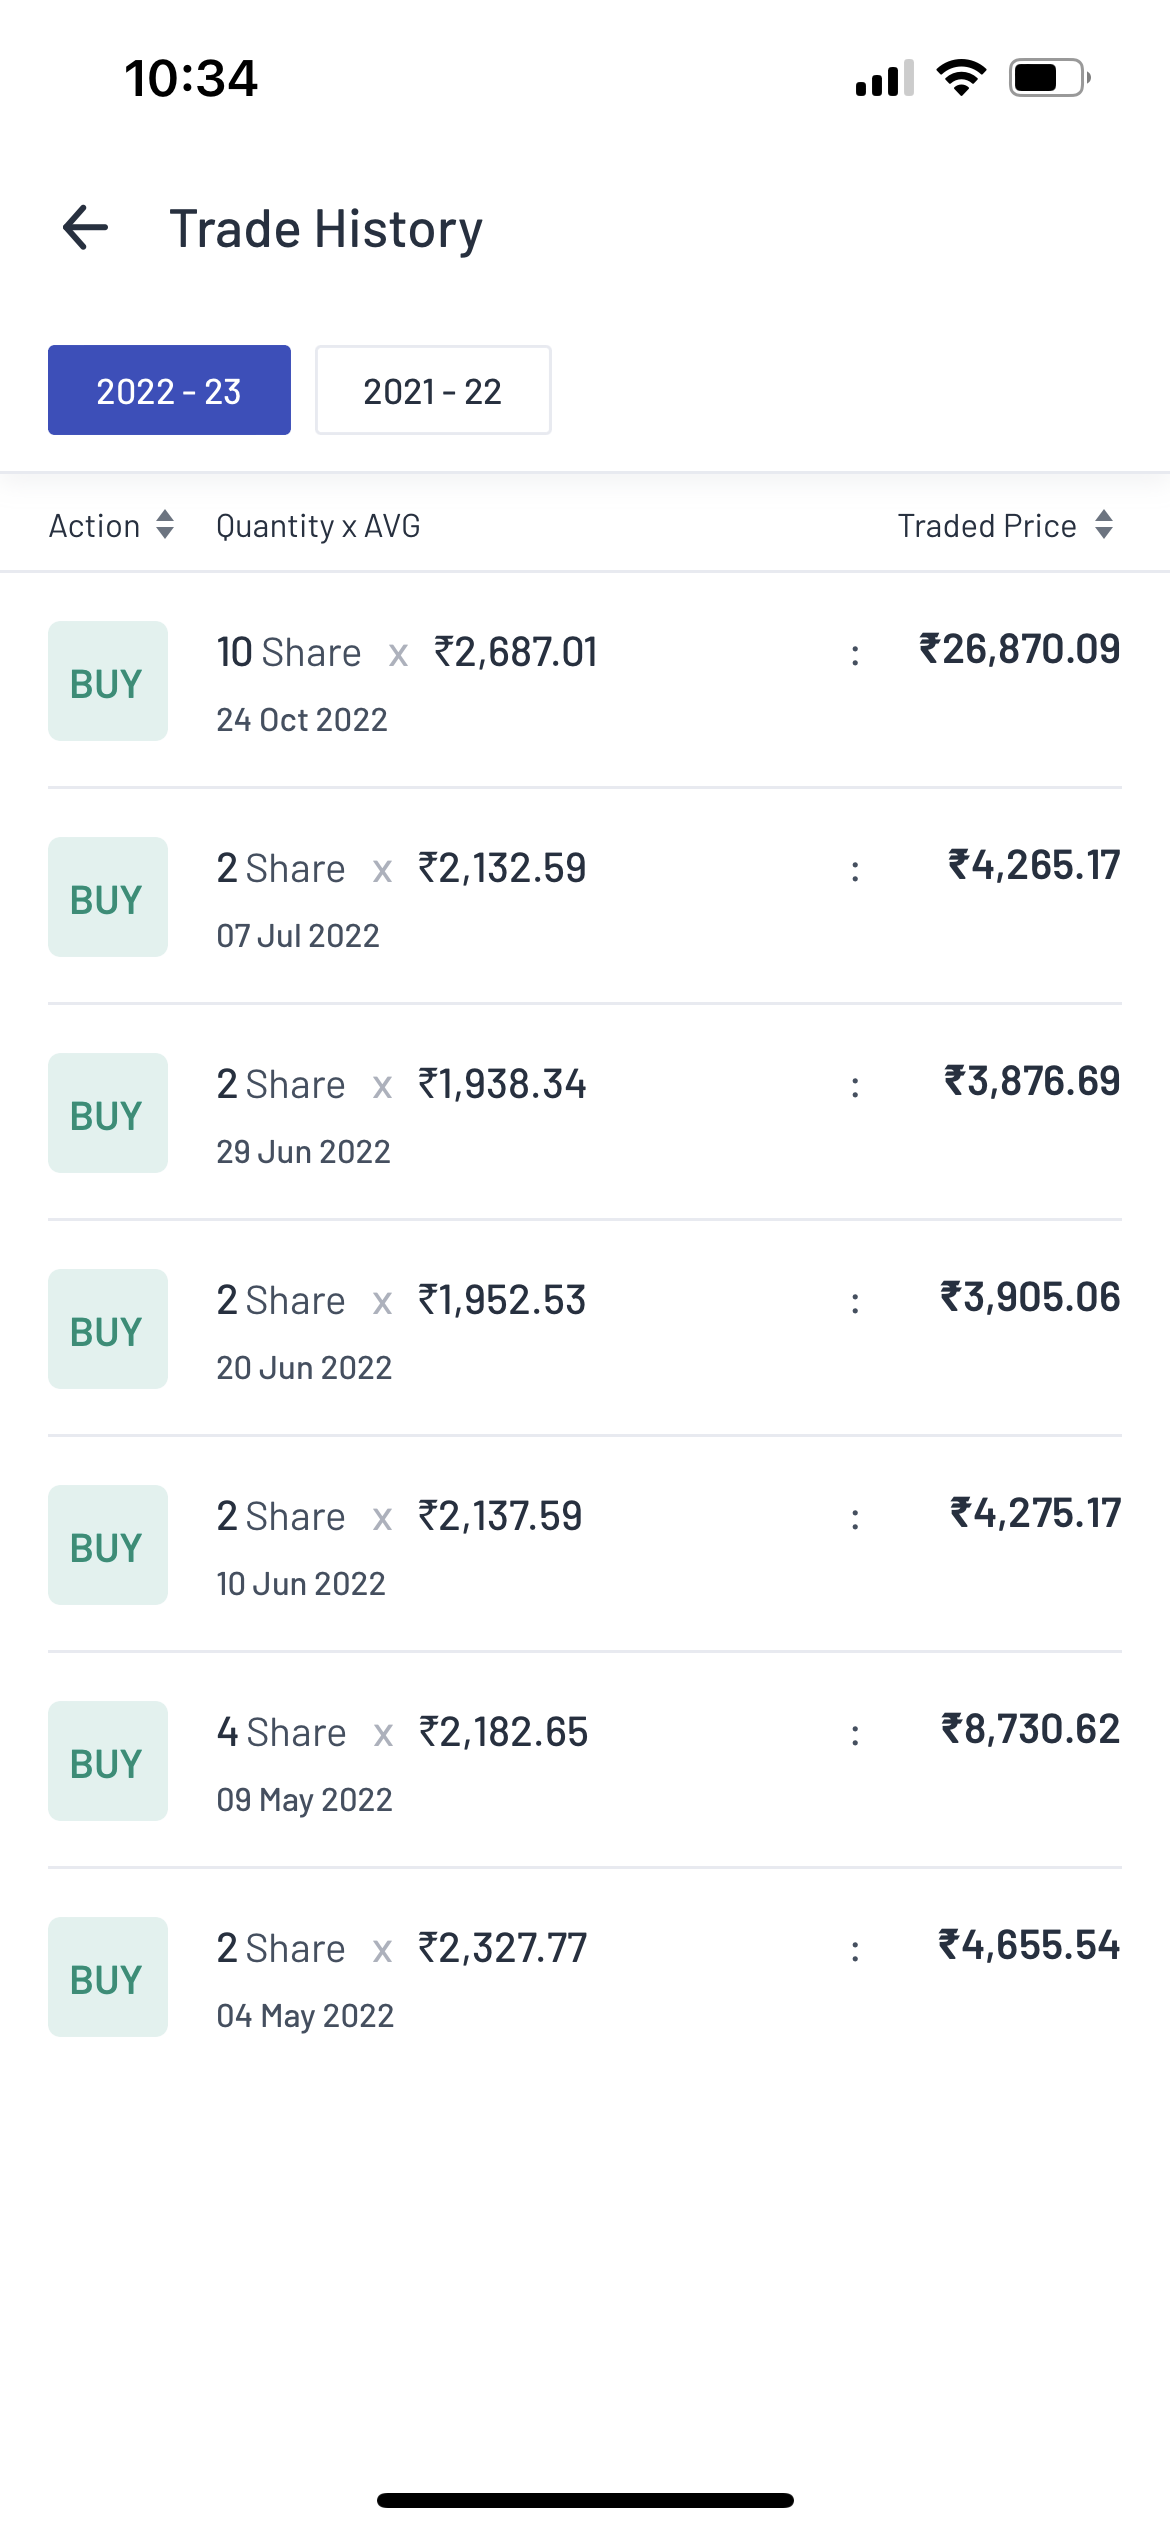
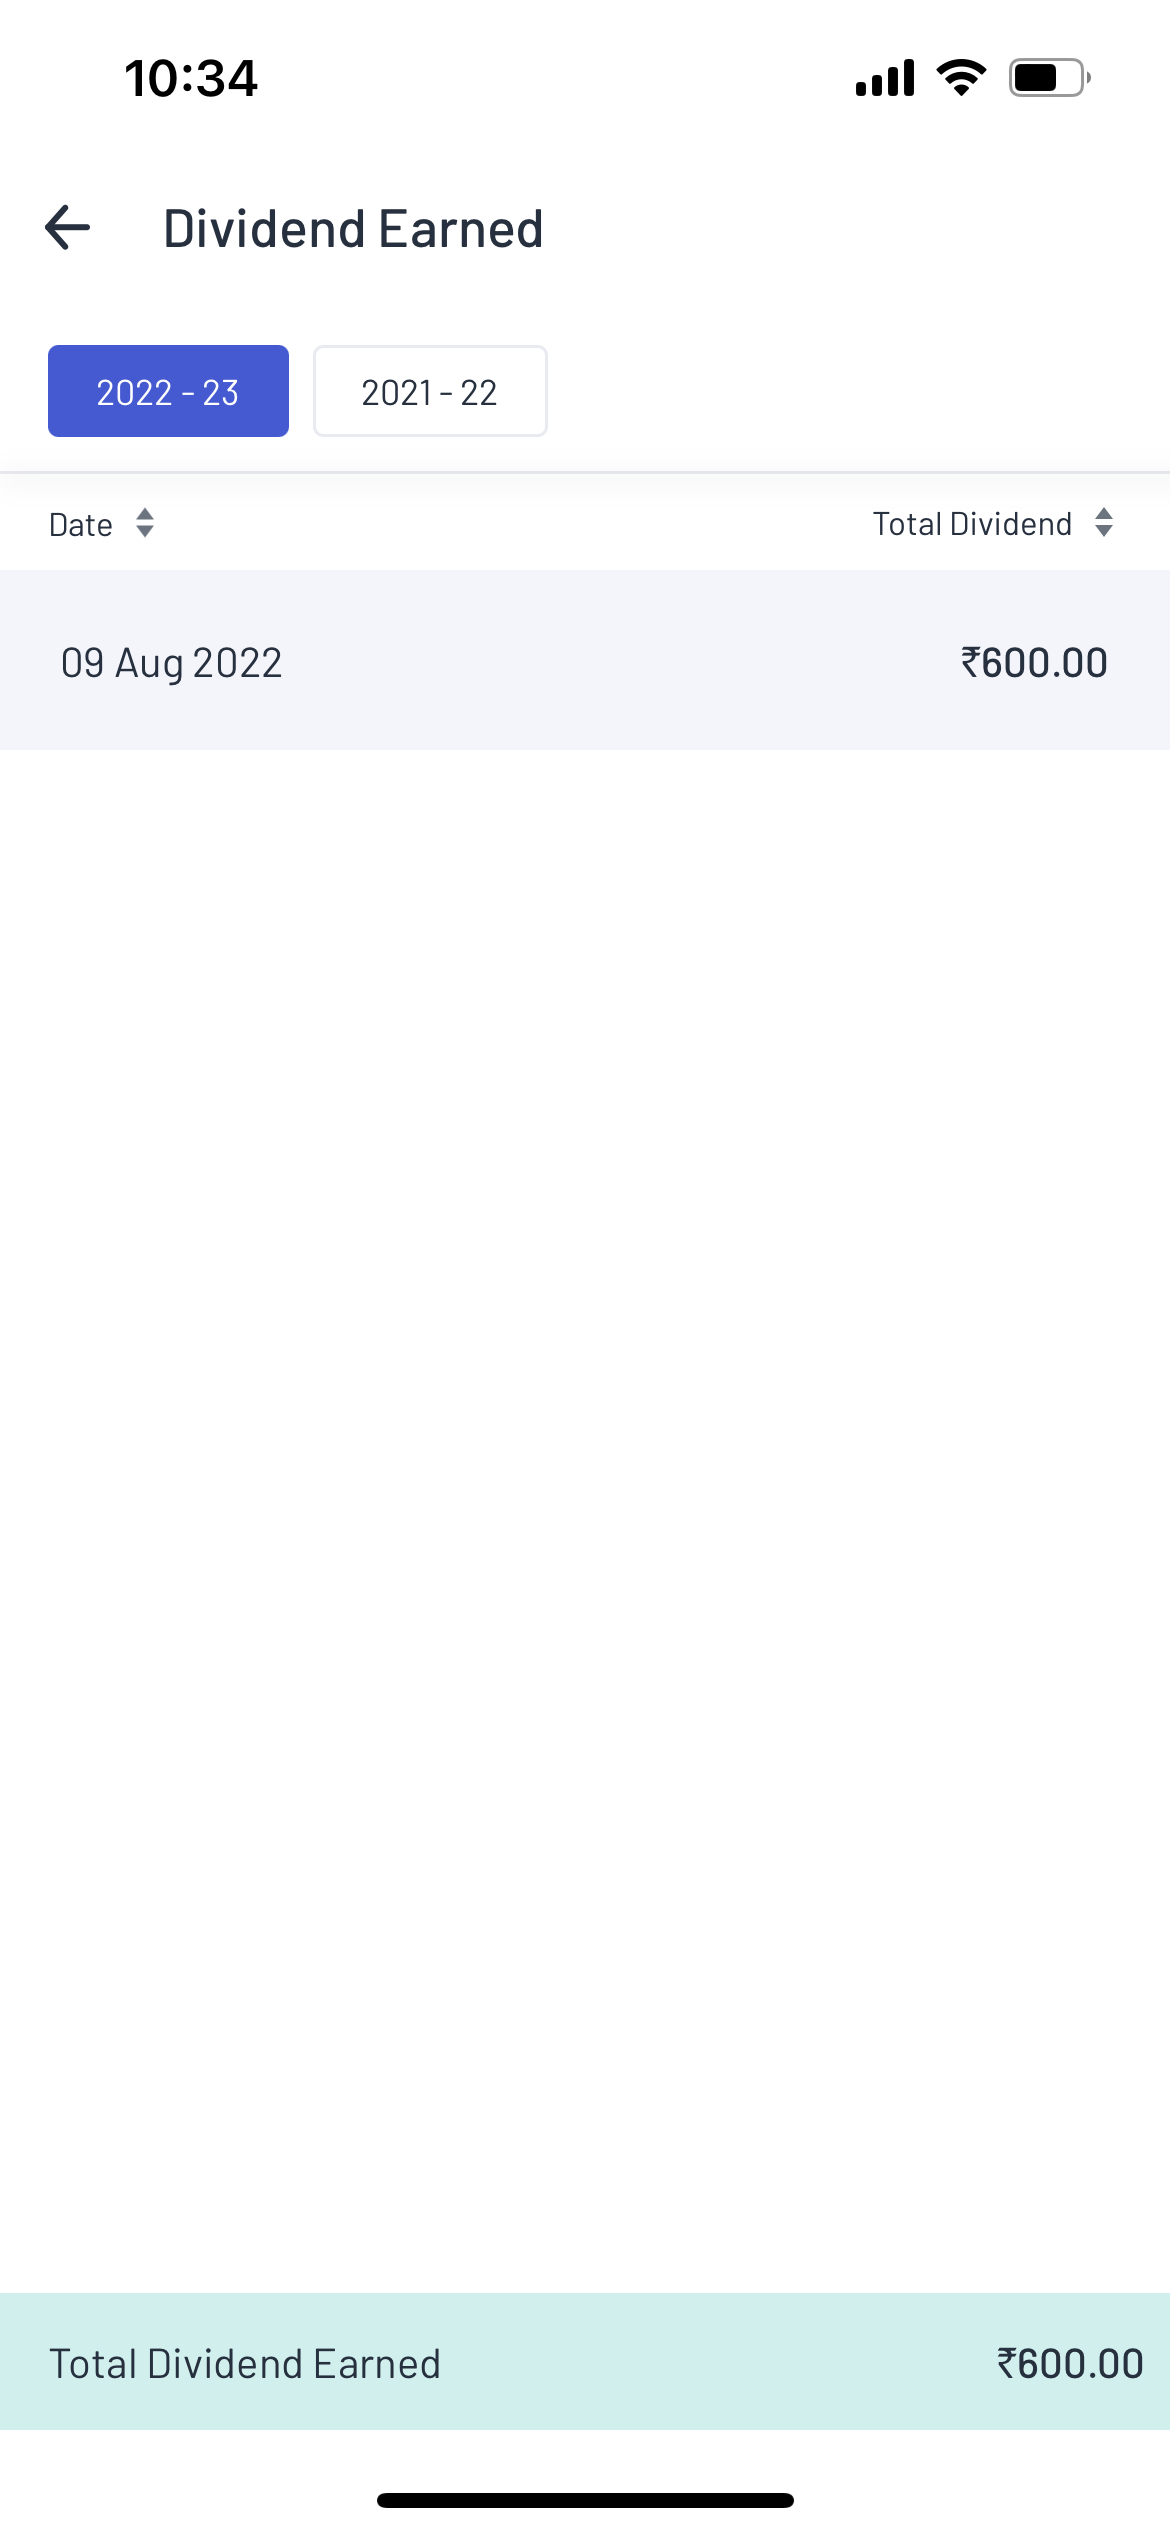
Fig.5: Trade History page (left) and Dividends Earned page (right)
Under the Dividend Earned page, you can view the list of the dividends paid to your account and the date when it was paid. The following information will be visible –
You can change the financial year for which the trades you are viewing by clicking the required financial year on the top of the page.
But wait! We have more…
In addition to the above changes, we have some more surprises for you!
Inactive stocks kept separate
Earlier, the stocks which became inactive (for various reasons, such as delisting) used to be located alongside active stocks. Therefore the reason behind their LTP going down to 0 would be unclear which would create confusion in the mind of the user.
However, from now on, users can view the following types of inactive stocks separately on their portfolio –
All these scrips and their details will be stated separately under the category of inactive stocks. Confusion on which stocks are active and which ones are inactive hence becomes zero! Now that’s what we call simple, user-oriented innovation.
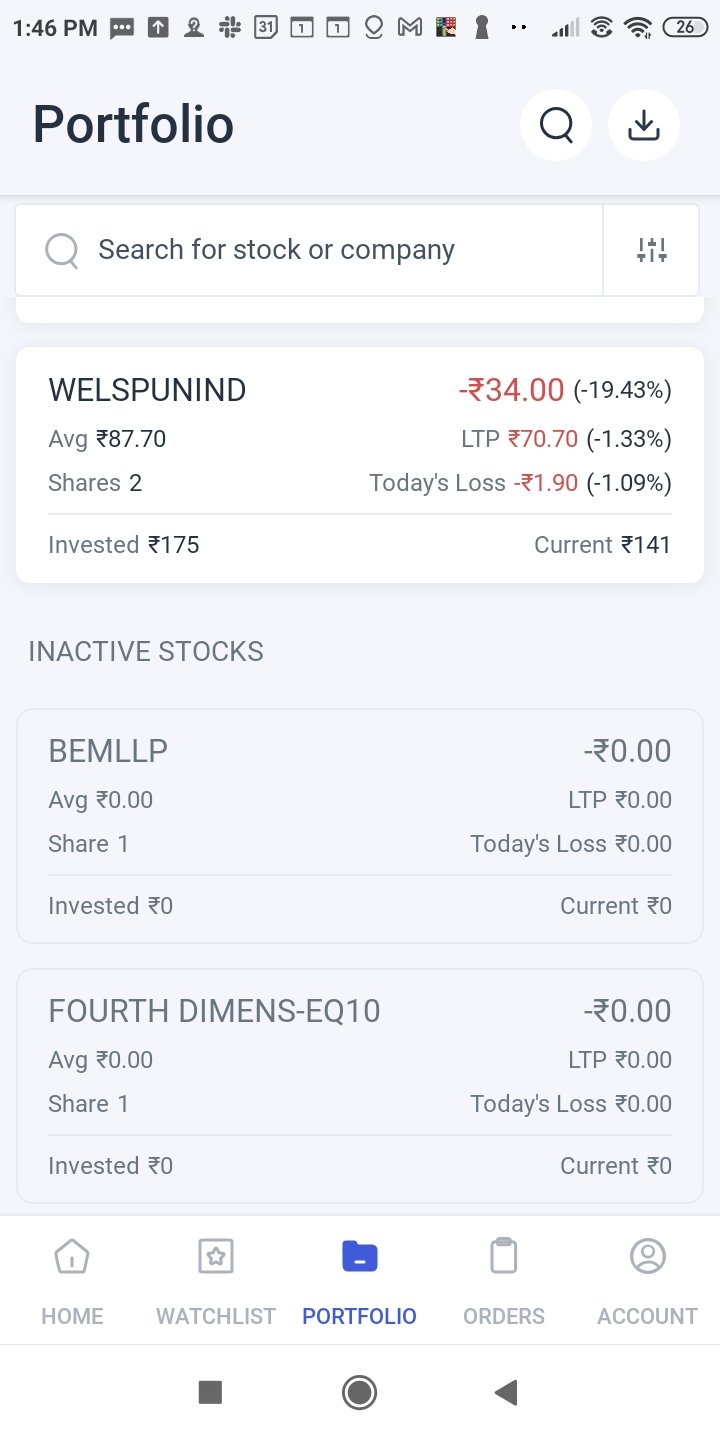
Fig.6: Inactive stocks will be listed separately as seen above
Advanced tech is one thing, but enhanced user experience is quite another. It’s with this philosophy that we have built the most user-friendly trading app in India.
If the above features interest you, open demat account with Angel One today to experience trading on a whole new level!
Published on: Dec 2, 2022, 5:58 PM IST
We're Live on WhatsApp! Join our channel for market insights & updates

Get the link to download the App

