
Selan Exploration Technology Ltd. is a strong breakout candidate for today. The stock price is currently trading at Rs 513 and has witnessed a very clean break-out of the ascending triangle chart pattern. The volume and other parameters of technical analysis are in sync with the breakout.
In the realm of technical analysis, the ascending triangle stands out as a prominent chart pattern that signals a potential continuation or reversal of an ongoing trend. Characterized by a horizontal upper trendline and an upward-sloping lower trendline, this pattern often emerges within an uptrend, indicating a period of consolidation before a potential upward breakout.
As price action oscillates between these converging trendlines, buyers gradually gain strength, pushing price higher towards the horizontal resistance level. This accumulation of buying pressure suggests a potential breakout to the upside, signalling the continuation of the uptrend. However, it’s important to note that breakouts can occur in either direction, and a downward breakout would indicate a reversal of the trend.
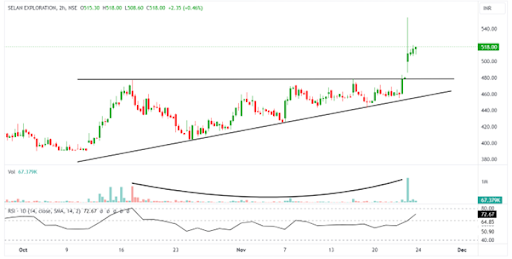
2-Hour chart of Selan Exploration Technology Ltd
Selan Exploration Technology gained strength in the 1st session of trading with higher volatility and extended as the day progressed to hit a 52-week high of Rs 554 despite consolidation in the Indian stock market indices.
The Selan Exploration stock witnessed a gap up opening at Rs 496, jumped to its 9-year high of Rs 554, and touched an intraday low of Rs 486 with a volume spike on Thursday. The stock is in a strong uptrend on a weekly basis.
Selan Exploration Technology has seen an ascending triangle pattern breakout as well as a breakout of the resistance trendline adjoining multiple touchpoints, which is a positive sign. The stock price broke its upper resistance of Rs 480 and traded high with sustenance; the volume was huge, 13.75 times more than the daily average. The volume chart also frames a feasible pattern for the ascending triangle as it decreases over time and gradually increased as breakout nears.
The relative strength index also entered the 65–80 range, suggesting bullish momentum for stock. The above image shows the 2-hour chart of Selan Exploration Technology with a day chart of RSI. The ADX indicator line is also at 39, showing the strength of the price trend.
During any corrective moves, the major support level to watch for is Rs 480. The overall structure remains favourable for traders, as the stock continues to trade above all its important moving averages, indicating a sustained upward trend.
The stock has given multibagger returns of 616.24% over its life period.
Disclaimer: This blog has been written exclusively for educational purposes. The securities mentioned are only examples and not recommendations. The information is based on various secondary sources on the internet and is subject to change. Please consult with a financial expert before making investment decisions.
Published on: Nov 23, 2023, 6:01 PM IST
We're Live on WhatsApp! Join our channel for market insights & updates

Get the link to download the App

